

Can Riot Platforms stock break $21.38 resistance as revenue surges and Anthropic signs lease?

Riot Platforms (RIOT) stock is trading at $20.72, registering an increase of 2.37% on the day. The share price sits above its key short-term moving average but remains below medium-term levels, with recent price action showing heightened volatility.
 17.12
17.12
Highlights
- Riot Platforms reported second-quarter 2026 revenue of $174.2 million, representing a 14% increase from the previous year.
- The company signed a 20-year, $9.1 billion agreement with Anthropic to lease part of its Rockdale, Texas campus for AI data centers.
- Riot Platforms stock trades in a $18.92 to $22.52 range with overbought signals and short-term upward probability at 57%.
Profit surge and major lease deal fuel renewed buying momentum
Riot Platforms posted a second-quarter 2026 revenue of $174.2 million, marking a 14% year-over-year increase that underscores operational momentum and robust demand for its core business lines. This stronger earnings performance has contributed to renewed market interest and supports increased buying activity. In addition, Riot Platforms secured a 20-year, $9.1 billion data center lease agreement with Anthropic, which will see part of its Rockdale, Texas campus repurposed as AI infrastructure, according to Coindesk. The dual impact of enhanced profitability and long-term contract wins highlights strategic progress that is fueling positive sentiment around the stock.
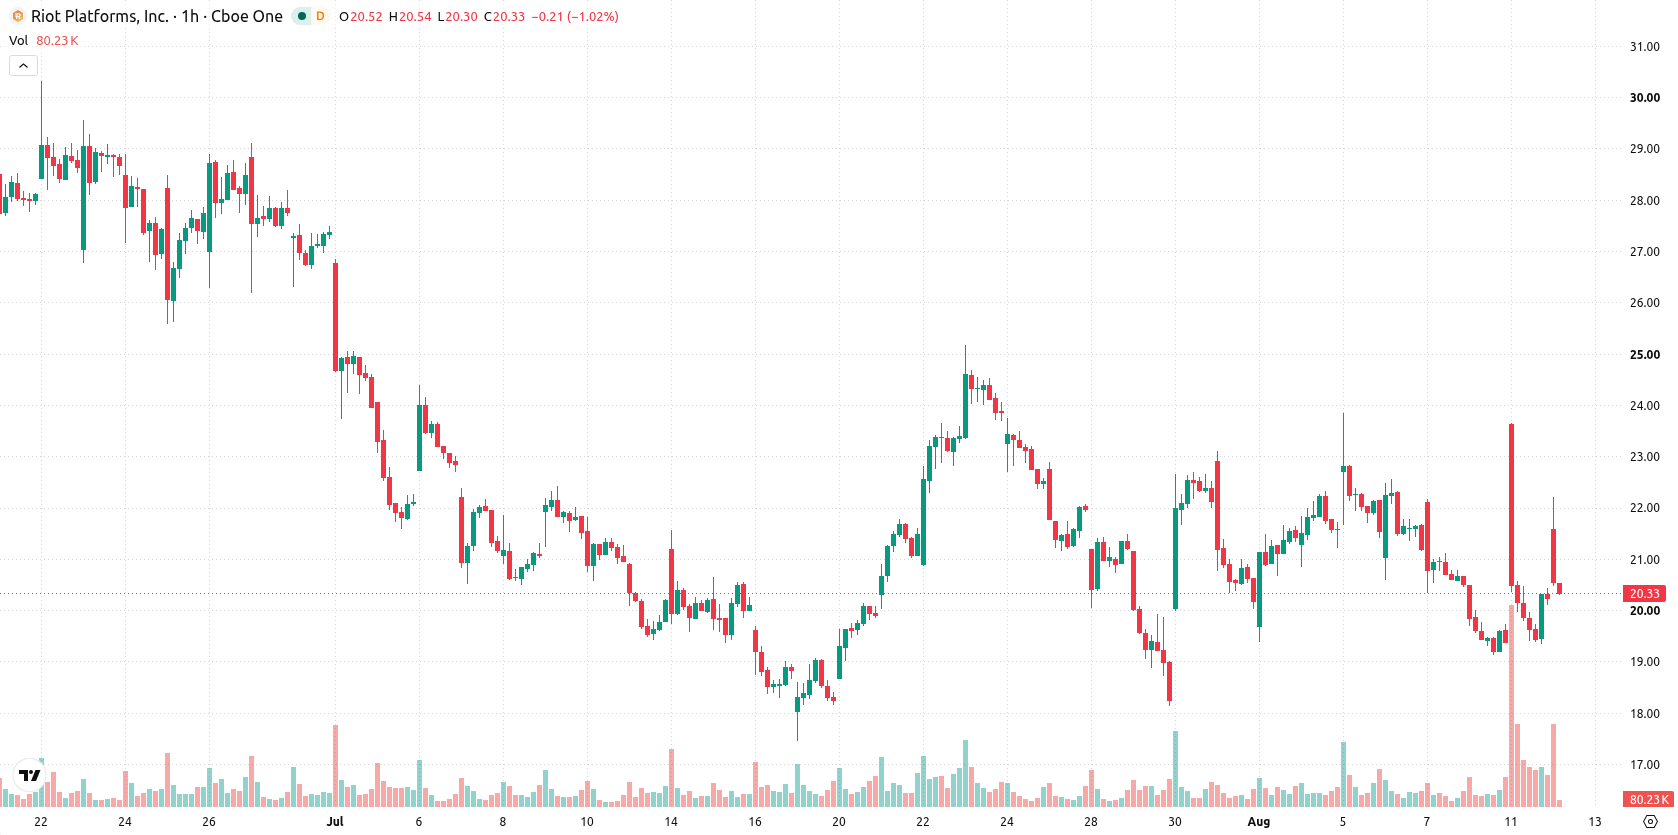
Mixed momentum and overbought signals amid short-term support
RIOT is trading above its MA-20, while sitting below its MA-50 on the hourly chart, indicating immediate support near short-term averages and ongoing resistance at medium-term levels. The price is holding above the MA-200, and the Ichimoku Kijun at $21.38 represents a key resistance to watch. Momentum signals are mixed: MACD is on a Strong Sell reading, but the ADX indicates ongoing buyer interest. Oscillators such as RSI, CCI, Stochastic RSI, and Bull/Bear Power all show overbought conditions and dominant buying presence intraday, while price action is near the session’s low with notable volatility.
Bullish bias as price eyes breakout above consolidation band
Looking ahead to the next several sessions, the anticipated trading range for RIOT is $18.92 to $22.52, indicating a volatility band relative to current levels. Statistically, upward movement holds a higher probability (57%), making a short-term pullback less likely. Sideways consolidation within this corridor is the baseline scenario, with a bullish breakout requiring a close above $21.38 and a bearish scenario opening below $18.92.
Earlier, analysts noted that Riot Platforms' long-term AI infrastructure initiatives and mixed technical signals positioned the stock for directional moves dependent on key resistance and support. The current analysis builds on this, with updated earnings confirming operational momentum, and traders are advised to monitor $21.38 as a breakout level that could define the next phase of price action.









-
 Afghanistan
-
 Albania
-
 Algeria
-
 Angola
-
 Argentina
-
 Armenia
-
 Australia
-
 Austria
-
 Azerbaijan
-
 Bahamas
-
 Bahrain
-
 Bangladesh
-
 Belarus
-
 Belgium
-
 Bolivia
-
 Botswana
-
 Brazil
-
 Brunei
-
 Bulgaria
-
 Cambodia
-
 Cameroon
-
 Canada
-
 Chile
-
 China
-
 Colombia
-
 Congo
-
 Costa Rica
-
 Cote d'Ivoire
-
 Croatia
-
 Cuba
-
 Cyprus
-
 Czechia
-
 DR Congo
-
 Denmark
-
 Dominican Republic
-
 Ecuador
-
 Egypt
-
 El Salvador
-
 Estonia
-
 Eswatini
-
 Ethiopia
-
 Finland
-
 France
-
 Georgia
-
 Germany
-
 Ghana
-
 Greece
-
 Haiti
-
 Hong Kong
-
 Hungary
-
 India
-
 Indonesia
-
 Iran, Islamic republic
-
 Iraq
-
 Ireland
-
 Israel
-
 Italy
-
 Jamaica
-
 Japan
-
 Jordan
-
 Kazakhstan
-
 Kenya
-
 Korea
-
 Kuwait
-
 Kyrgyzstan
-
 Laos
-
 Latvia
-
 Lebanon
-
 Lesotho
-
 Libya
-
 Lithuania
-
 Luxembourg
-
 Madagascar
-
 Malaysia
-
 Malta
-
 Mauritius
-
 Mexico
-
 Moldova
-
 Mongolia
-
 Montenegro
-
 Morocco
-
 Mozambique
-
 Myanmar
-
 Namibia
-
 Nepal
-
 Netherlands
-
 New Zealand
-
 Nigeria
-
 North Macedonia
-
 Norway
-
 Oman
-
 Pakistan
-
 Palestine
-
 Panama
-
 Papua New Guinea
-
 Paraguay
-
 Peru
-
 Philippines
-
 Poland
-
 Portugal
-
 Puerto Rico
-
 Qatar
-
 Reunion
-
 Romania
-
 Rwanda
-
 Saudi Arabia
-
 Serbia
-
 Singapore
-
 Slovakia
-
 Slovenia
-
 Somalia
-
 South Africa
-
 Spain
-
 Sri Lanka
-
 Sweden
-
 Switzerland
-
 Syria
-
 Taiwan
-
 Tajikistan
-
 Tanzania
-
 Thailand
-
 Trinidad and Tobago
-
 Tunisia
-
 Turkey
-
 UAE
-
 Uganda
-
 Ukraine
-
 United Kingdom
-
United States
-
 Uruguay
-
 Uzbekistan
-
 Venezuela
-
 Vietnam
-
 Yemen
-
 Zambia
-
 Zimbabwe
- Forex
- Crypto












