

CGC rallies as Q1 revenue rises and EBITDA loss narrows sharply

Canopy Growth (CGC) stock is trading at $1.03 after rising 3% on the day, outperforming its short- and medium-term moving averages while remaining below longer-term trends.
 0.7000
Highlights
- Canopy Growth reported a first-quarter adjusted EBITDA loss of $3.2 million, 59% less than the prior year, as cost controls improved.
- Revenue rose 13% for the quarter and integration of MTL Cannabis is expected to generate $10 million in synergies over 18 months.
- Technical signals show strong bullish momentum for CGC stock, with an expected trading range of $0.99 to $1.07 over the next several days.
Margin gains and sales growth as cost controls boost sentiment
Canopy Growth Corp reported a first-quarter adjusted EBITDA loss of $3.2 million, marking a 59% improvement year-over-year and demonstrating clear progress in cost controls and operational discipline. The company also posted a 13% increase in revenue for the period, indicating accelerating sales momentum and demand for its product lineup. Ongoing integration of the MTL Cannabis acquisition, with a targeted $10 million in synergies over 18 months according to Finance Yahoo, is expected to further enhance margins and operational scale. Additionally, consolidated net revenue growth and a reduction in adjusted EBITDA losses compared to the previous period were noted by Kalkine, reinforcing the fundamental underpinnings for the current positive market response.
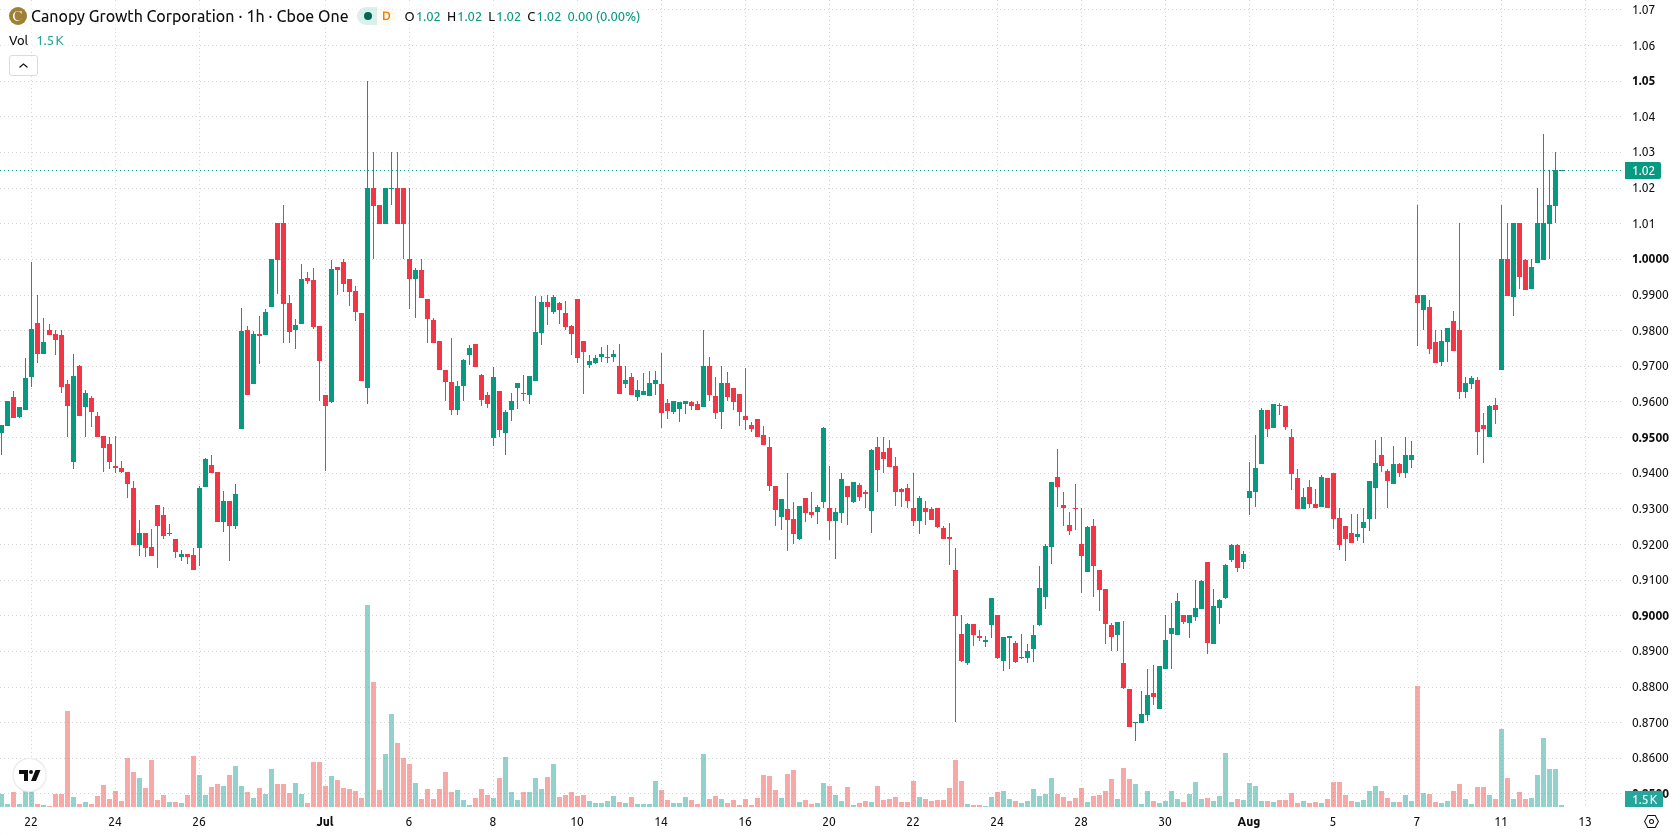
Momentum strength meets overbought signals as buyers test resistance
On the hourly chart, CGC has moved above the MA-20 and MA-50, while the daily chart places it below the MA-200. Immediate technical support is defined by the Ichimoku Kijun line at $0.99. Momentum readings are strong, as both MACD and ADX are flashing buy signals, and the Awesome Oscillator is also positive. However, RSI is at 64.91 and both Stoch RSI and CCI are in overbought territory, indicating that the recent buying may be approaching exhaustion. Bull/Bear Power further confirms that buyers are dominating intraday action, yet some divergence appears as oscillators signal over-extension amid continued momentum.
Upward bias and technical boundaries shape short-term trading risks
In the coming days, CGC is likely to trade within a band between $0.99 and $1.07, based on current volatility and order flow. There is a 79% probability of an upward move, with only a 21% chance of a downward shift. If resistance levels are breached, an extension of gains is possible, while any failure of support at $0.99 could see a renewed wave of selling pressure. For now, consolidation in this corridor appears to be the baseline scenario.
Previously it was reported that Canopy Growth faced ongoing longer-term bearish pressure despite improved financial performance and operational synergies. The current analysis adds that, while recent momentum has driven the stock above short- and medium-term averages, traders should closely monitor the $0.99 support and $1.07 resistance as key levels for the next directional move.










-
 Afghanistan
-
 Albania
-
 Algeria
-
 Angola
-
 Argentina
-
 Armenia
-
 Australia
-
 Austria
-
 Azerbaijan
-
 Bahamas
-
 Bahrain
-
 Bangladesh
-
 Belarus
-
 Belgium
-
 Bolivia
-
 Botswana
-
 Brazil
-
 Brunei
-
 Bulgaria
-
 Cambodia
-
 Cameroon
-
 Canada
-
 Chile
-
 China
-
 Colombia
-
 Congo
-
 Costa Rica
-
 Cote d'Ivoire
-
 Croatia
-
 Cuba
-
 Cyprus
-
 Czechia
-
 DR Congo
-
 Denmark
-
 Dominican Republic
-
 Ecuador
-
 Egypt
-
 El Salvador
-
 Estonia
-
 Eswatini
-
 Ethiopia
-
 Finland
-
 France
-
 Georgia
-
 Germany
-
 Ghana
-
 Greece
-
 Haiti
-
 Hong Kong
-
 Hungary
-
 India
-
 Indonesia
-
 Iran, Islamic republic
-
 Iraq
-
 Ireland
-
 Israel
-
 Italy
-
 Jamaica
-
 Japan
-
 Jordan
-
 Kazakhstan
-
 Kenya
-
 Korea
-
 Kuwait
-
 Kyrgyzstan
-
 Laos
-
 Latvia
-
 Lebanon
-
 Lesotho
-
 Libya
-
 Lithuania
-
 Luxembourg
-
 Madagascar
-
 Malaysia
-
 Malta
-
 Mauritius
-
 Mexico
-
 Moldova
-
 Mongolia
-
 Montenegro
-
 Morocco
-
 Mozambique
-
 Myanmar
-
 Namibia
-
 Nepal
-
 Netherlands
-
 New Zealand
-
 Nigeria
-
 North Macedonia
-
 Norway
-
 Oman
-
 Pakistan
-
 Palestine
-
 Panama
-
 Papua New Guinea
-
 Paraguay
-
 Peru
-
 Philippines
-
 Poland
-
 Portugal
-
 Puerto Rico
-
 Qatar
-
 Reunion
-
 Romania
-
 Rwanda
-
 Saudi Arabia
-
 Serbia
-
 Singapore
-
 Slovakia
-
 Slovenia
-
 Somalia
-
 South Africa
-
 Spain
-
 Sri Lanka
-
 Sweden
-
 Switzerland
-
 Syria
-
 Taiwan
-
 Tajikistan
-
 Tanzania
-
 Thailand
-
 Trinidad and Tobago
-
 Tunisia
-
 Turkey
-
 UAE
-
 Uganda
-
 Ukraine
-
 United Kingdom
-
United States
-
 Uruguay
-
 Uzbekistan
-
 Venezuela
-
 Vietnam
-
 Yemen
-
 Zambia
-
 Zimbabwe
- Forex
- Crypto












