

UK focus on energy security: Can National Grid stock hold above GBX1,191 support?

National Grid (NG) stock is trading at GBX1,194.50, marking a modest decline for the session. The price sits just below its key short-term average but still holds above longer-term support levels.
 1279.50
Highlights
- National Grid manages a major network investment programme with regulated cash flows supporting a large-scale capital cycle.
- Market attention focuses on the company’s project execution and regulatory compliance, affecting perceptions of risk and capital discipline.
- Shares of National Grid traded with moderate volatility in the range of GBX1,178 to GBX1,210, with technical signals mixed and no clear near-term trend.
Network investment scrutiny intensifies amid focus on regulated cash flow
National Grid's active management of a large-scale network investment programme, as highlighted by Kalkinemedia, has drawn market attention to how its regulated cash flows can absorb the demands of a substantial capital cycle. This heightened focus has placed the company's execution—particularly regarding project delivery and adherence to regulatory allowances—under close evaluation, shaping institutional perceptions around risk management and capital discipline. Alongside these factors, renewed investor interest in energy security and resilient grid infrastructure continues to highlight the company’s strategic importance in UK policy and has kept the sector in focus, according to Kalkinemedia.
Mixed momentum signals as technical levels contain direction
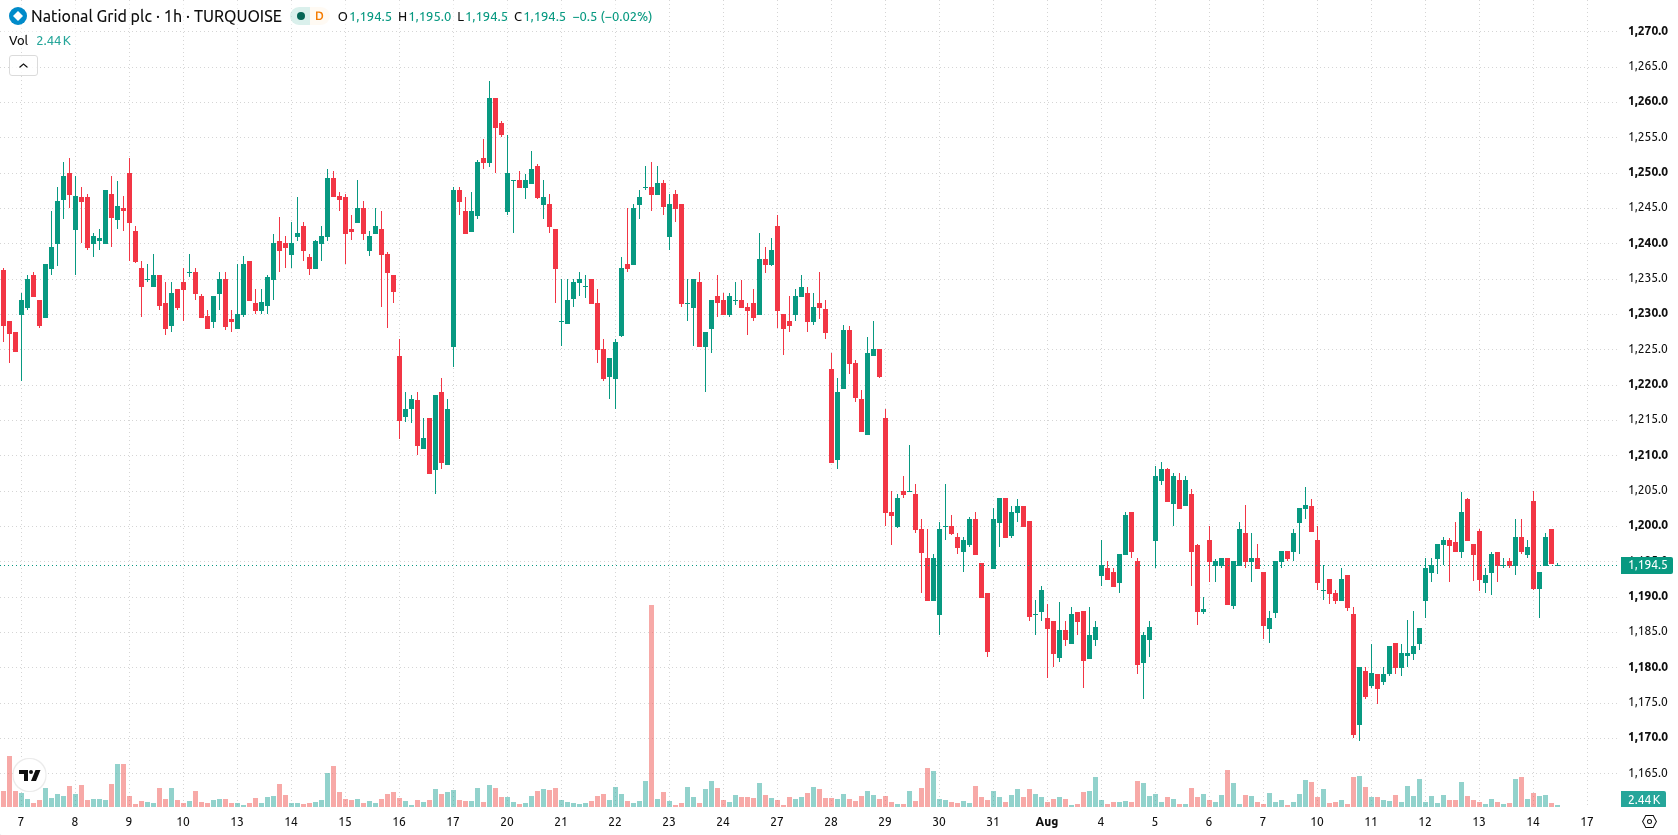
Technically, NG trades below its MA-20 at GBX1,196 on the H1 chart, yet remains above MA-50 at GBX1,191, with the daily MA-200 capping long-term upside near GBX1,232. Immediate intraday support is identified at the Ichimoku Kijun of GBX1,191. Momentum indicators present a mixed picture: MACD shows a Strong Buy reading, ADX is Neutral, RSI stands at 54.73 with a Buy signal, CCI also signals Buy, Stochastic RSI is Neutral, and Bull/Bear Power is Overbought. These diverging signals point to indecisive short-term conditions, with buyers present but intraday strength appearing stretched.
Range-bound outlook as volatility keeps breakout risks balanced
Over the coming 2 to 3 trading days, the projected price range for NG is GBX1,178 to GBX1,210—an interval consistent with recent volatility. Probabilities remain evenly split at 50% for both upward and downward moves, suggesting the likeliest outcome is continued consolidation within this band. Should the price break above resistance, momentum could accelerate to the upside, while a decisive move below GBX1,191 support may prompt renewed selling pressure.
Earlier, analysts noted that National Grid's trading was characterized by consolidation, with technical signals pointing to both support and resistance amid an uncertain directional outlook. The current analysis adds a layer of focus on project execution and regulatory discipline, highlighting continued consolidation as the default scenario and advising close attention to price action near the GBX1,191 support level for any shift in momentum.






Latest National Grid News




-
 Afghanistan
-
 Albania
-
 Algeria
-
 Angola
-
 Argentina
-
 Armenia
-
 Australia
-
 Austria
-
 Azerbaijan
-
 Bahamas
-
 Bahrain
-
 Bangladesh
-
 Belarus
-
 Belgium
-
 Bolivia
-
 Botswana
-
 Brazil
-
 Brunei
-
 Bulgaria
-
 Cambodia
-
 Cameroon
-
 Canada
-
 Chile
-
 China
-
 Colombia
-
 Congo
-
 Costa Rica
-
 Cote d'Ivoire
-
 Croatia
-
 Cuba
-
 Cyprus
-
 Czechia
-
 DR Congo
-
 Denmark
-
 Dominican Republic
-
 Ecuador
-
 Egypt
-
 El Salvador
-
 Estonia
-
 Eswatini
-
 Ethiopia
-
 Finland
-
 France
-
 Georgia
-
 Germany
-
 Ghana
-
 Greece
-
 Haiti
-
 Hong Kong
-
 Hungary
-
 India
-
 Indonesia
-
 Iran, Islamic republic
-
 Iraq
-
 Ireland
-
 Israel
-
 Italy
-
 Jamaica
-
 Japan
-
 Jordan
-
 Kazakhstan
-
 Kenya
-
 Korea
-
 Kuwait
-
 Kyrgyzstan
-
 Laos
-
 Latvia
-
 Lebanon
-
 Lesotho
-
 Libya
-
 Lithuania
-
 Luxembourg
-
 Madagascar
-
 Malaysia
-
 Malta
-
 Mauritius
-
 Mexico
-
 Moldova
-
 Mongolia
-
 Montenegro
-
 Morocco
-
 Mozambique
-
 Myanmar
-
 Namibia
-
 Nepal
-
 Netherlands
-
 New Zealand
-
 Nigeria
-
 North Macedonia
-
 Norway
-
 Oman
-
 Pakistan
-
 Palestine
-
 Panama
-
 Papua New Guinea
-
 Paraguay
-
 Peru
-
 Philippines
-
 Poland
-
 Portugal
-
 Puerto Rico
-
 Qatar
-
 Reunion
-
 Romania
-
 Rwanda
-
 Saudi Arabia
-
 Serbia
-
 Singapore
-
 Slovakia
-
 Slovenia
-
 Somalia
-
 South Africa
-
 Spain
-
 Sri Lanka
-
 Sweden
-
 Switzerland
-
 Syria
-
 Taiwan
-
 Tajikistan
-
 Tanzania
-
 Thailand
-
 Trinidad and Tobago
-
 Tunisia
-
 Turkey
-
 UAE
-
 Uganda
-
 Ukraine
-
 United Kingdom
-
United States
-
 Uruguay
-
 Uzbekistan
-
 Venezuela
-
 Vietnam
-
 Yemen
-
 Zambia
-
 Zimbabwe
- Forex
- Crypto












