

The Trade Desk stock slips below $13.89 support after major client spending slowdown persists

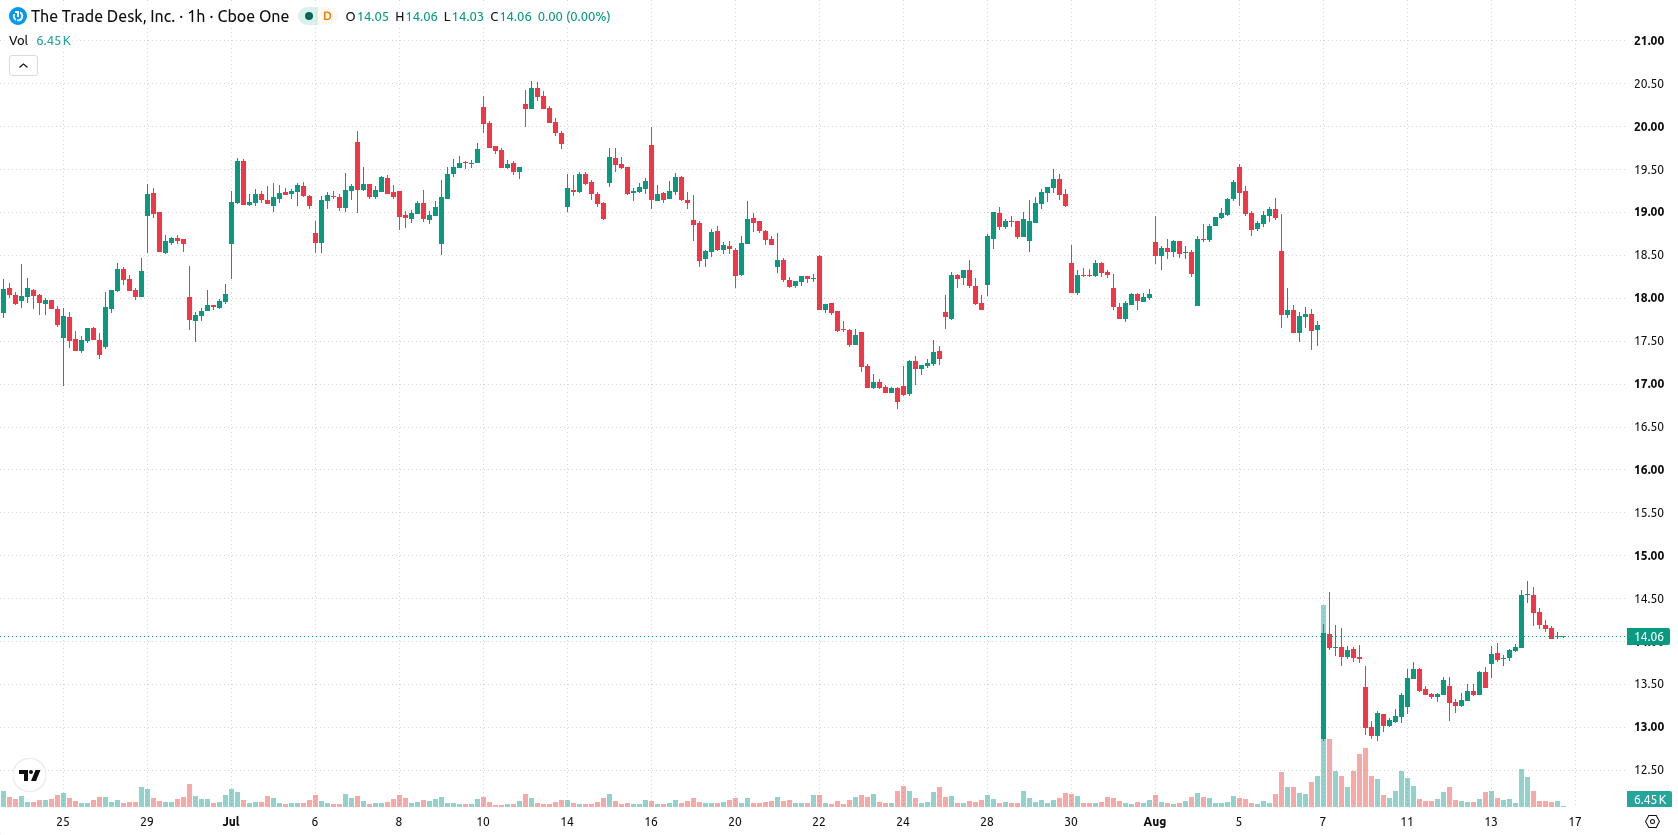
The Trade Desk (TTD) stock is trading at $14.08 after falling 3.33% today. The price sits above its key short-term moving average, but below medium- and long-term averages.
 13.31
13.31
13.31
13.31
Highlights
- The Trade Desk stock missed second quarter revenue estimates with a 3% year-over-year increase to $715 million.
- Management flagged that lower spending from major clients is expected to continue impacting performance at least through the third quarter.
- Support is identified at $13.89 with a projected trading range of $13.24 to $14.92 as signals indicate continued downside risk and high volatility.
Weaker revenue guidance fuels prolonged spending caution
The Trade Desk reported a weaker-than-expected second quarter, with revenue increasing by only 3% year-over-year to $715 million and missing analyst estimates, according to Finance Yahoo. This shortfall was attributed by management to lower spending from large existing clients, a condition expected to persist at least through the third quarter as reported by Fool. As of June 30, 2026, the company maintained approximately $1.5 billion in cash and equivalents, which provides liquidity but does not offset concerns raised by the recent earnings miss.
Mixed momentum signals amid support at Ichimoku Kijun
On the technical front, TTD is trading above its MA-20 while staying below both the MA-50 and MA-200 levels. The Ichimoku Kijun currently sits at $13.89 and serves as the nearest support. Momentum signals are mixed: RSI is at 48.88 and ADX reflects ongoing selling pressure, whereas MACD, Stochastic RSI, and CCI all present neutral or indecisive readings. Bull/Bear Power suggests some intraday buyer activity that tempers overall weakness, and the Awesome Oscillator is also neutral. Oscillator divergences add to the uncertain technical outlook.
Sideways trading outlook amid downside risk dominance
Looking ahead, TTD is expected to trade within a volatility band of $13.24 to $14.92 over the next several sessions. There is a 76% probability of a move lower, compared to just a 24% chance of an upward break. The baseline scenario calls for sideways movement within this range; a sustained move above immediate resistance would set up a bullish outcome, while a drop below the Kijun and established support would confirm further downside.
Previously it was reported that The Trade Desk’s stock had exhibited persistent technical weakness following a disappointing earnings report and continued selling pressure. The current analysis adds a more nuanced technical outlook amid mixed momentum signals, highlighting the importance of the $13.89 Kijun support as a key level to watch for confirmation of either stabilization or renewed downside risk.





Latest The Trade Desk News




-
 Afghanistan
-
 Albania
-
 Algeria
-
 Angola
-
 Argentina
-
 Armenia
-
 Australia
-
 Austria
-
 Azerbaijan
-
 Bahamas
-
 Bahrain
-
 Bangladesh
-
 Belarus
-
 Belgium
-
 Bolivia
-
 Botswana
-
 Brazil
-
 Brunei
-
 Bulgaria
-
 Cambodia
-
 Cameroon
-
 Canada
-
 Chile
Chile
-
 China
China
-
 Colombia
-
 Congo
Congo
-
 Costa Rica
-
 Cote d'Ivoire
-
 Croatia
-
 Cuba
Cuba
-
 Cyprus
-
 Czechia
-
 DR Congo
-
 Denmark
-
 Dominican Republic
-
 Ecuador
-
 Egypt
Egypt
-
 El Salvador
-
 Estonia
-
 Eswatini
-
 Ethiopia
-
 Finland
-
 France
-
 Georgia
-
 Germany
-
 Ghana
Ghana
-
 Greece
-
 Haiti
Haiti
-
 Hong Kong
-
 Hungary
-
 India
India
-
 Indonesia
-
 Iran, Islamic republic
-
 Iraq
Iraq
-
 Ireland
-
 Israel
-
 Italy
Italy
-
 Jamaica
-
 Japan
Japan
-
 Jordan
-
 Kazakhstan
-
 Kenya
Kenya
-
 Korea
Korea
-
 Kuwait
-
 Kyrgyzstan
-
 Laos
Laos
-
 Latvia
-
 Lebanon
-
 Lesotho
-
 Libya
Libya
-
 Lithuania
-
 Luxembourg
-
 Madagascar
-
 Malaysia
-
 Malta
Malta
-
 Mauritius
-
 Mexico
-
 Moldova
-
 Mongolia
-
 Montenegro
-
 Morocco
-
 Mozambique
-
 Myanmar
-
 Namibia
-
 Nepal
Nepal
-
 Netherlands
-
 New Zealand
-
 Nigeria
-
 North Macedonia
-
 Norway
-
 Oman
Oman
-
 Pakistan
-
 Palestine
-
 Panama
-
 Papua New Guinea
-
 Paraguay
-
 Peru
Peru
-
 Philippines
-
 Poland
-
 Portugal
-
 Puerto Rico
-
 Qatar
Qatar
-
 Reunion
-
 Romania
-
 Rwanda
-
 Saudi Arabia
-
 Serbia
-
 Singapore
-
 Slovakia
-
 Slovenia
-
 Somalia
-
 South Africa
-
 Spain
Spain
-
 Sri Lanka
-
 Sweden
-
 Switzerland
-
 Syria
Syria
-
 Taiwan
-
 Tajikistan
-
 Tanzania
-
 Thailand
-
 Trinidad and Tobago
-
 Tunisia
-
 Turkey
-
 UAE
UAE
-
 Uganda
-
 Ukraine
-
 United Kingdom
-
United States
-
 Uruguay
-
 Uzbekistan
-
 Venezuela
-
 Vietnam
-
 Yemen
Yemen
-
 Zambia
-
 Zimbabwe
- Forex
- Crypto












