

Can HP stock regain momentum as rising trend support falters?

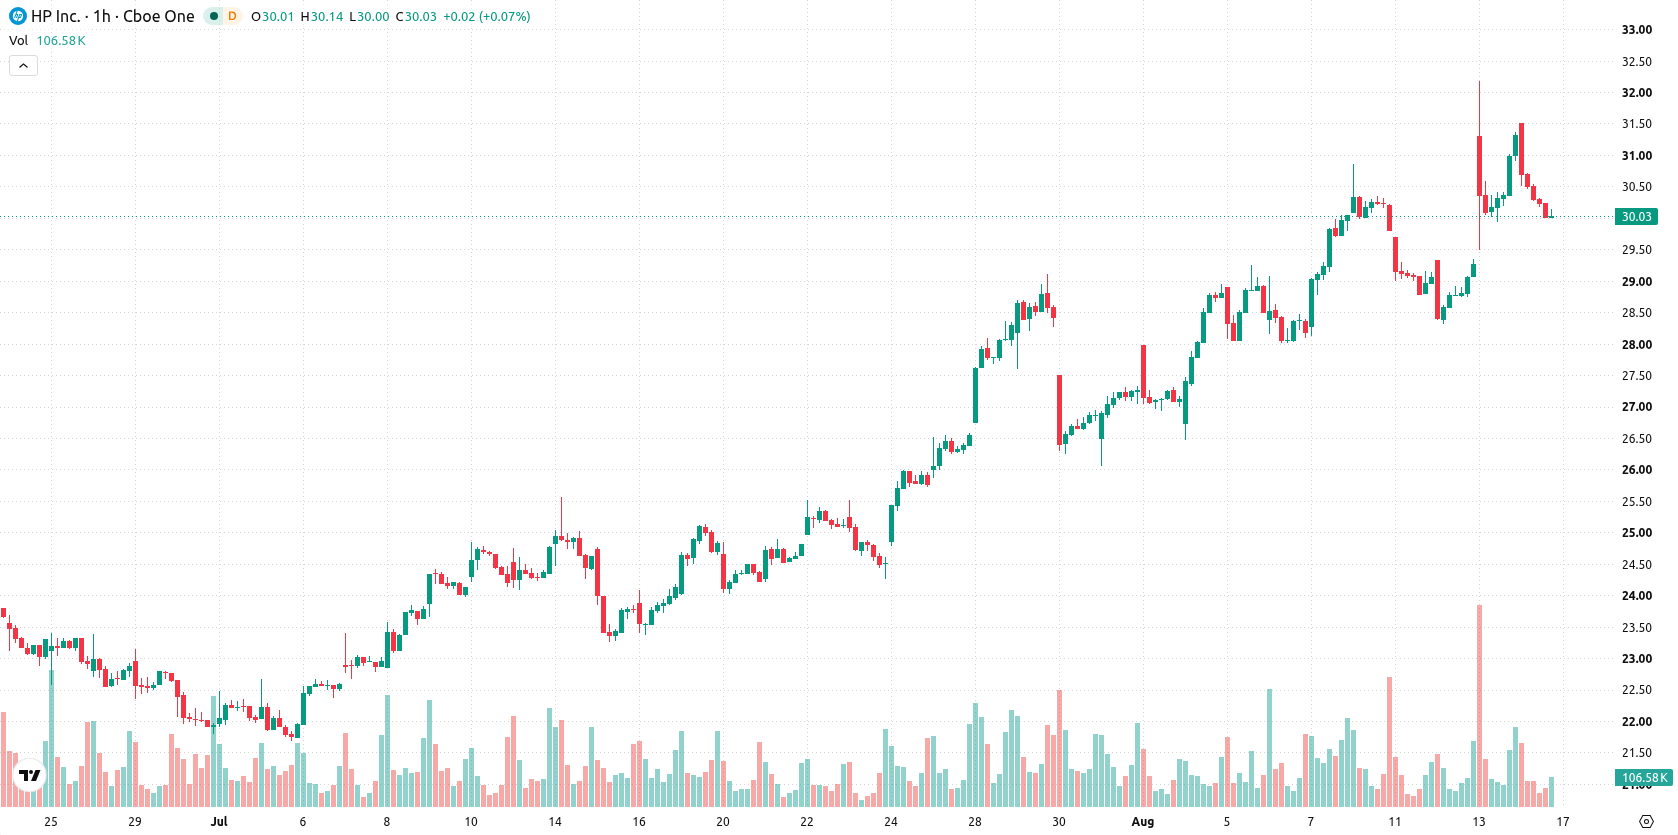
HP Inc. (HPQ) stock is trading at $30.03, down 4.06% for the day. The price currently stands above its key short- and medium-term moving averages, maintaining an overall supportive technical backdrop.
 28.45
33.40
Highlights
- HP Inc. revenue increased 9% year over year to $14.41 billion in the second quarter of fiscal 2026.
- Management raised full-year 2026 non-GAAP EPS guidance to $2.90 to $3.10, indicating increased earnings expectations.
- HP Inc. stock trades with a bullish technical bias, forecast to range between $28.29 and $31.77 in the near term.
Upbeat earnings and guidance underpin sentiment but fail to spark rally
HP Inc.'s revenue rose 9% year over year to $14.41 billion in the second quarter of fiscal 2026, and management increased its full-year 2026 non-GAAP EPS guidance to $2.90–$3.10, according to Finance Yahoo. This strong quarterly performance points to improving fundamentals and signals management's confidence in earnings quality for the remainder of the year. These corporate developments serve as a positive backdrop for the stock, though price action has remained under broader selling pressure.
Conflicting momentum and resistance highlight volatility risk
On the technical front, HPQ has closed above the MA-20 and MA-50 on the H1 timeframe, and remains well above the MA-200 on the daily chart. The Ichimoku Kijun on the daily sits at $30.25, marking immediate resistance. Momentum indicators are mixed: MACD signals a Strong Buy and ADX supports a Buy, indicating continued upward momentum, while RSI is modest at 52.56 (Buy) and Stochastic RSI is Oversold, highlighting possible exhaustion. CCI is Neutral, Bull/Bear Power points to intraday seller dominance with a Sell, and the Awesome Oscillator is Neutral, not reinforcing the trend. This pattern suggests high volatility and some short-term downside pressure despite the generally positive momentum backdrop.
Rangebound outlook as volatility bands define scenario odds
In the short term, HPQ is expected to trade between $28.29 and $31.77, reflecting a volatility band relative to current levels. There is a 75% probability of an upward move, while a decline is less likely at 25%. The baseline scenario anticipates HPQ remaining rangebound within these levels. A bullish breakout may occur if the price closes above $30.25 resistance, whereas a move below $28.29 would increase downside risk.
In a recent review, analysts noted that HP Inc. maintained a broadly bullish technical structure supported by shareholder returns and positive momentum readings. The current technical setup suggests a sideways consolidation with elevated volatility, making a sustained close above $30.25 a pivotal level for signaling the next directional move.










-
 Afghanistan
-
 Albania
-
 Algeria
-
 Angola
-
 Argentina
-
 Armenia
-
 Australia
-
 Austria
-
 Azerbaijan
-
 Bahamas
-
 Bahrain
-
 Bangladesh
-
 Belarus
-
 Belgium
-
 Bolivia
-
 Botswana
-
 Brazil
-
 Brunei
-
 Bulgaria
-
 Cambodia
-
 Cameroon
-
 Canada
-
 Chile
-
 China
-
 Colombia
-
 Congo
-
 Costa Rica
-
 Cote d'Ivoire
-
 Croatia
-
 Cuba
-
 Cyprus
-
 Czechia
-
 DR Congo
-
 Denmark
-
 Dominican Republic
-
 Ecuador
-
 Egypt
-
 El Salvador
-
 Estonia
-
 Eswatini
-
 Ethiopia
-
 Finland
-
 France
-
 Georgia
-
 Germany
-
 Ghana
-
 Greece
-
 Haiti
-
 Hong Kong
-
 Hungary
-
 India
-
 Indonesia
-
 Iran, Islamic republic
-
 Iraq
-
 Ireland
-
 Israel
-
 Italy
-
 Jamaica
-
 Japan
-
 Jordan
-
 Kazakhstan
-
 Kenya
-
 Korea
-
 Kuwait
-
 Kyrgyzstan
-
 Laos
-
 Latvia
-
 Lebanon
-
 Lesotho
-
 Libya
-
 Lithuania
-
 Luxembourg
-
 Madagascar
-
 Malaysia
-
 Malta
-
 Mauritius
-
 Mexico
-
 Moldova
-
 Mongolia
-
 Montenegro
-
 Morocco
-
 Mozambique
-
 Myanmar
-
 Namibia
-
 Nepal
-
 Netherlands
-
 New Zealand
-
 Nigeria
-
 North Macedonia
-
 Norway
-
 Oman
-
 Pakistan
-
 Palestine
-
 Panama
-
 Papua New Guinea
-
 Paraguay
-
 Peru
-
 Philippines
-
 Poland
-
 Portugal
-
 Puerto Rico
-
 Qatar
-
 Reunion
-
 Romania
-
 Rwanda
-
 Saudi Arabia
-
 Serbia
-
 Singapore
-
 Slovakia
-
 Slovenia
-
 Somalia
-
 South Africa
-
 Spain
-
 Sri Lanka
-
 Sweden
-
 Switzerland
-
 Syria
-
 Taiwan
-
 Tajikistan
-
 Tanzania
-
 Thailand
-
 Trinidad and Tobago
-
 Tunisia
-
 Turkey
-
 UAE
-
 Uganda
-
 Ukraine
-
 United Kingdom
-
United States
-
 Uruguay
-
 Uzbekistan
-
 Venezuela
-
 Vietnam
-
 Yemen
-
 Zambia
-
 Zimbabwe
- Forex
- Crypto












