

What's behind Hubbell's latest 3.5% stock pullback?

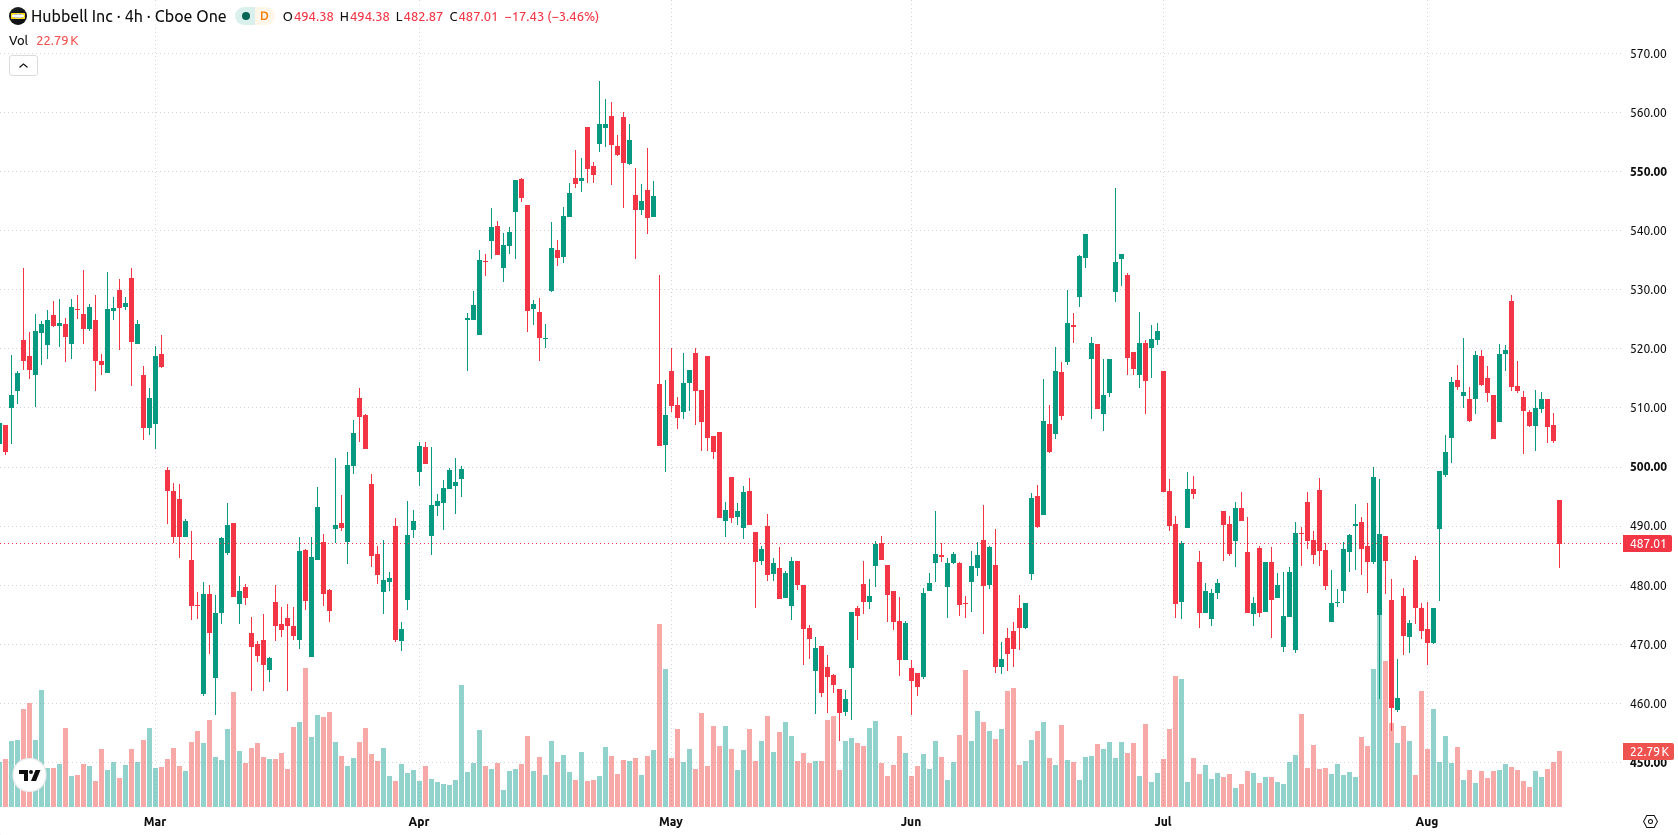
Hubbell Inc (HUBB) slid 3.51% amid persistent selling, even as recent news highlighted its standing as a defensively positioned core holding in the utility infrastructure sector. The move is supported by short- and medium-term technical pressure, with the stock still trading below its 20- and 50-day moving averages.
 446.00
447.43
Highlights
- Hubbell Incorporated is positioned as a key long-term holding in physical infrastructure, supported by persistent utility sector investment and standardized essential products.
- The company maintains strong cash flow conversion and cost pass-through capability, expanding operating margins and offering downside protection from utility expenditure cycles.
- Hubbell stock trades under short- and medium-term selling pressure, currently near the 200-day support at $484.99, with a projected short-term price range of $463.29 to $500.15.
Margin expansion and cash flow strong as sector flow underpins resilience
Hubbell Incorporated was recognized as a core long-term investment in the physical infrastructure market, benefiting from ongoing utility sector spending and standardized product offerings. The company has reported strong cash flow conversion and a proven ability to pass through raw material costs, expanding its operating margins. Hubbell's products are considered essential with downside risk protected by utility rate-base capital expenditure cycles, though price action has remained under broader selling pressure.
Short-term bearish structure persists as mixed momentum clouds longer trend
Hubbell trades below its 20-day and 50-day moving averages ($494.69 and $494.89), but remains above the 200-day moving average at $484.99. This positioning signals short- and medium-term pressure from sellers, though longer-term structure continues to be bullish. The immediate range is constrained by resistance at the Ichimoku Kijun ($492.23) and support at the 200-day ($484.99). Momentum indicators present a mixed picture: the MACD stays positive and signals a buy, but the ADX at 12.16 suggests weak trend strength. The RSI at 52.78 and CCI at 54.32 both lean bullish and avoid overbought or oversold extremes. Bull/Bear Power at 9.26 confirms buyers dominate intraday, yet flags overbought conditions. The stock opened with a downside gap of nearly $9.92 (about 1.97%) and is currently trading near session lows at $486.61, slipping $17.69 or 3.51%. Intraday volatility stands at 2.29%, pointing to continued pressure after the gap down. Stochastic RSI and Awesome Oscillator offer neutral signals, highlighting divergence between intraday weakness and some underlying positive momentum.
Earlier, analysts noted that Hubbell’s longer-term momentum remained constructive despite heightened short-term selling pressure and mixed technical signals. The current setup reaffirms that near-term downside risk persists, but with volatility elevated and key levels in play, traders should monitor price action around the 200-day moving average for signs of a sustained reversal or further breakdown.






Latest Hubbell Inc News




-
 Afghanistan
-
 Albania
-
 Algeria
-
 Angola
-
 Argentina
-
 Armenia
-
 Australia
-
 Austria
-
 Azerbaijan
-
 Bahamas
-
 Bahrain
-
 Bangladesh
-
 Belarus
-
 Belgium
-
 Bolivia
-
 Botswana
-
 Brazil
-
 Brunei
-
 Bulgaria
-
 Cambodia
-
 Cameroon
-
 Canada
-
 Chile
-
 China
-
 Colombia
-
 Congo
-
 Costa Rica
-
 Cote d'Ivoire
-
 Croatia
-
 Cuba
-
 Cyprus
-
 Czechia
-
 DR Congo
-
 Denmark
-
 Dominican Republic
-
 Ecuador
-
 Egypt
-
 El Salvador
-
 Estonia
-
 Eswatini
-
 Ethiopia
-
 Finland
-
 France
-
 Georgia
-
 Germany
-
 Ghana
-
 Greece
-
 Haiti
-
 Hong Kong
-
 Hungary
-
 India
-
 Indonesia
-
 Iran, Islamic republic
-
 Iraq
-
 Ireland
-
 Israel
-
 Italy
-
 Jamaica
-
 Japan
-
 Jordan
-
 Kazakhstan
-
 Kenya
-
 Korea
-
 Kuwait
-
 Kyrgyzstan
-
 Laos
-
 Latvia
-
 Lebanon
-
 Lesotho
-
 Libya
-
 Lithuania
-
 Luxembourg
-
 Madagascar
-
 Malaysia
-
 Malta
-
 Mauritius
-
 Mexico
-
 Moldova
-
 Mongolia
-
 Montenegro
-
 Morocco
-
 Mozambique
-
 Myanmar
-
 Namibia
-
 Nepal
-
 Netherlands
-
 New Zealand
-
 Nigeria
-
 North Macedonia
-
 Norway
-
 Oman
-
 Pakistan
-
 Palestine
-
 Panama
-
 Papua New Guinea
-
 Paraguay
-
 Peru
-
 Philippines
-
 Poland
-
 Portugal
-
 Puerto Rico
-
 Qatar
-
 Reunion
-
 Romania
-
 Rwanda
-
 Saudi Arabia
-
 Serbia
-
 Singapore
-
 Slovakia
-
 Slovenia
-
 Somalia
-
 South Africa
-
 Spain
-
 Sri Lanka
-
 Sweden
-
 Switzerland
-
 Syria
-
 Taiwan
-
 Tajikistan
-
 Tanzania
-
 Thailand
-
 Trinidad and Tobago
-
 Tunisia
-
 Turkey
-
 UAE
-
 Uganda
-
 Ukraine
-
 United Kingdom
-
United States
-
 Uruguay
-
 Uzbekistan
-
 Venezuela
-
 Vietnam
-
 Yemen
-
 Zambia
-
 Zimbabwe
- Forex
- Crypto












