

Q2 revenue misses analyst expectations: ASTS support levels in focus

AST SpaceMobile (ASTS) stock is trading at $67.07, down 5.72% on the day. The price currently sits below its key moving averages, reflecting continued near-term weakness.
 34.50
38.11
Highlights
- AST SpaceMobile reported second-quarter 2026 revenue of $31.52 million, doubling sequentially but coming in about 10% below analyst forecasts.
- The company posted a $125.9 million loss due to the BlueBird 7 satellite event and strengthened liquidity to over $3.7 billion after a $1.15 billion convertible debt raise.
- Shares of AST SpaceMobile trade below key moving averages as short-term momentum indicators signal downside, with an expected price range of $63.07 to $71.07 and a 76% probability of further decline.
Revenue miss and satellite loss drive increased execution risk and liquidity actions
AST SpaceMobile reported second-quarter 2026 revenue of $31.52 million, representing doubled sequential growth but falling about 10% short of analyst expectations, according to 24/7 Wall St. The quarter also included a $125.9 million loss tied to the involuntary conversion from the BlueBird 7 satellite incident, highlighting company-specific execution risks and significantly impacting reported results. In parallel, the company increased its pro forma cash above $3.7 billion through a $1.15 billion convertible debt offering, which bolsters its liquidity position going into the second half of 2026. Ongoing FCC review of Ligado Networks’ L-band spectrum plan, with its potential long-term access to up to 45 MHz for AST, further shapes the evolving regulatory backdrop.
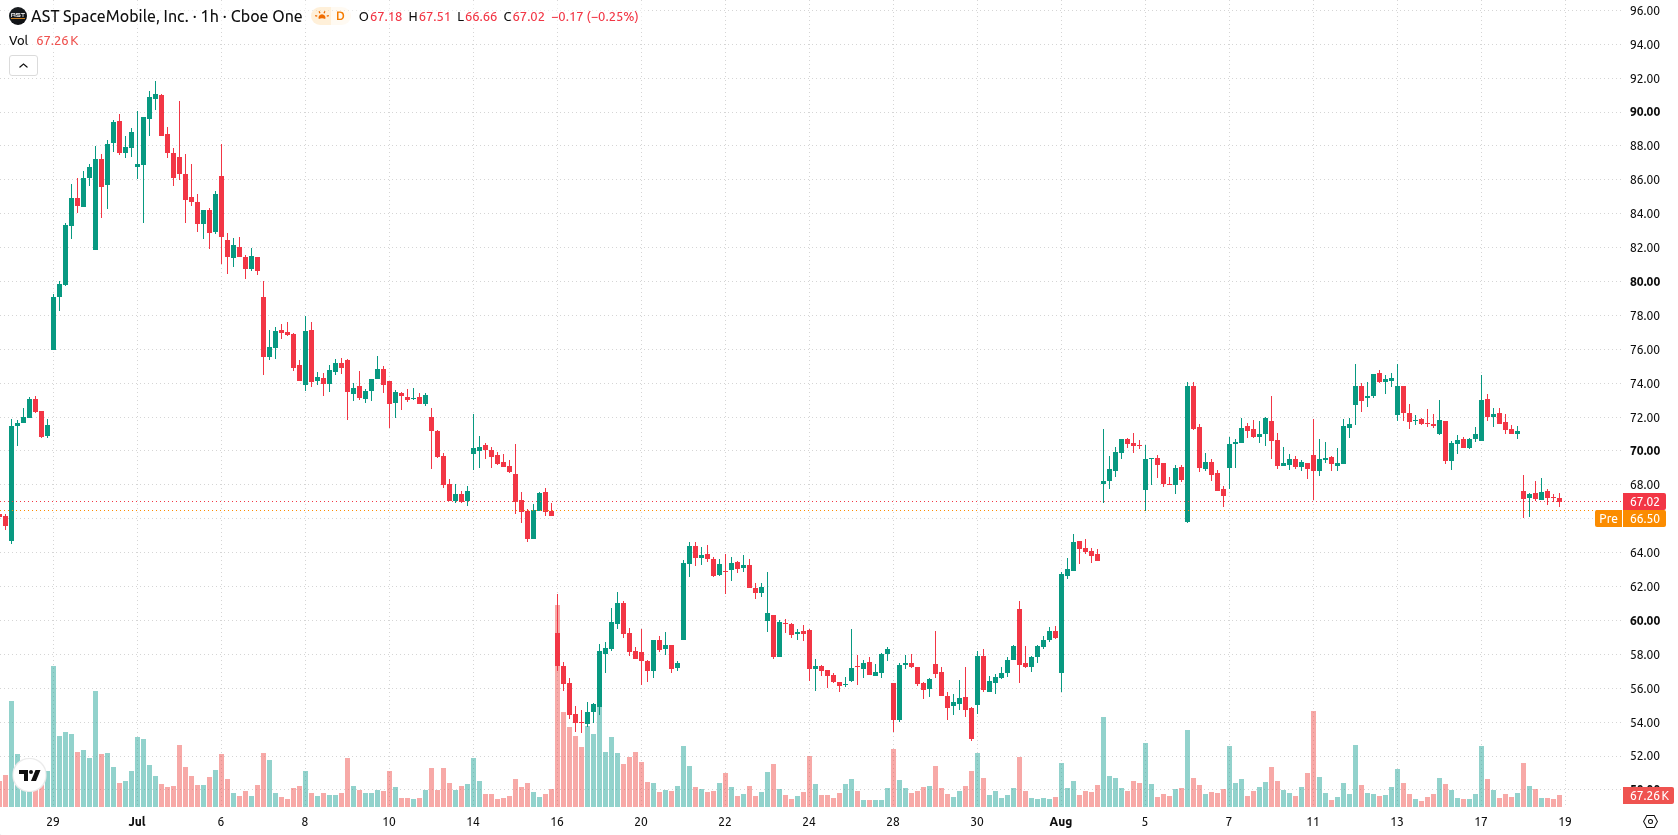
Seller dominance and oversold signals as downside technicals persist
On the hourly chart, ASTS is trading below the MA-20 and MA-50, and remains well under the MA-200 on the daily timeframe. The Ichimoku Kijun stands at $70.24, setting immediate resistance. Support is found near $63.07, with resistance near $71.07. MACD and ADX are registering sell signals. RSI shows downward momentum at 34.62, while Stoch RSI, CCI, and Bull/Bear Power all indicate oversold conditions and continued seller dominance. The Awesome Oscillator is currently neutral and does not confirm the prevailing trend.
Downside risk outweighs rebound as price tests volatility range
Looking ahead, ASTS is expected to remain within a volatility band between $63.07 and $71.07 over the next several sessions. A bullish scenario would require a sustained move above the Ichimoku Kijun at $70.24. However, a breakdown through support at $63.07 would likely accelerate further downside. The probability model assigns a 24% chance to an upward move, while a continued drop is more probable at 76%.
Earlier, analysts noted that AST SpaceMobile continued to face persistent selling pressure and ambiguous technical signals, despite notable progress on its commercial initiatives. The current setup reinforces this caution, with downside risk prevailing as traders should closely monitor the $63.07 support for potential acceleration of losses.






Latest AST SpaceMobile News



-
 Afghanistan
-
 Albania
-
 Algeria
-
 Angola
-
 Argentina
-
 Armenia
-
 Australia
-
 Austria
-
 Azerbaijan
-
 Bahamas
-
 Bahrain
-
 Bangladesh
-
 Belarus
-
 Belgium
-
 Bolivia
-
 Botswana
-
 Brazil
-
 Brunei
-
 Bulgaria
-
 Cambodia
-
 Cameroon
-
 Canada
-
 Chile
-
 China
-
 Colombia
-
 Congo
-
 Costa Rica
-
 Cote d'Ivoire
-
 Croatia
-
 Cuba
-
 Cyprus
-
 Czechia
-
 DR Congo
-
 Denmark
-
 Dominican Republic
-
 Ecuador
-
 Egypt
-
 El Salvador
-
 Estonia
-
 Eswatini
-
 Ethiopia
-
 Finland
-
 France
-
 Georgia
-
 Germany
-
 Ghana
-
 Greece
-
 Haiti
-
 Hong Kong
-
 Hungary
-
 India
-
 Indonesia
-
 Iran, Islamic republic
-
 Iraq
-
 Ireland
-
 Israel
-
 Italy
-
 Jamaica
-
 Japan
-
 Jordan
-
 Kazakhstan
-
 Kenya
-
 Korea
-
 Kuwait
-
 Kyrgyzstan
-
 Laos
-
 Latvia
-
 Lebanon
-
 Lesotho
-
 Libya
-
 Lithuania
-
 Luxembourg
-
 Madagascar
-
 Malaysia
-
 Malta
-
 Mauritius
-
 Mexico
-
 Moldova
-
 Mongolia
-
 Montenegro
-
 Morocco
-
 Mozambique
-
 Myanmar
-
 Namibia
-
 Nepal
-
 Netherlands
-
 New Zealand
-
 Nigeria
-
 North Macedonia
-
 Norway
-
 Oman
-
 Pakistan
-
 Palestine
-
 Panama
-
 Papua New Guinea
-
 Paraguay
-
 Peru
-
 Philippines
-
 Poland
-
 Portugal
-
 Puerto Rico
-
 Qatar
-
 Reunion
-
 Romania
-
 Rwanda
-
 Saudi Arabia
-
 Serbia
-
 Singapore
-
 Slovakia
-
 Slovenia
-
 Somalia
-
 South Africa
-
 Spain
-
 Sri Lanka
-
 Sweden
-
 Switzerland
-
 Syria
-
 Taiwan
-
 Tajikistan
-
 Tanzania
-
 Thailand
-
 Trinidad and Tobago
-
 Tunisia
-
 Turkey
-
 UAE
-
 Uganda
-
 Ukraine
-
 United Kingdom
-
United States
-
 Uruguay
-
 Uzbekistan
-
 Venezuela
-
 Vietnam
-
 Yemen
-
 Zambia
-
 Zimbabwe
- Forex
- Crypto












