

Berkshire Hathaway shares remain pinned as Stoch RSI enters oversold zone: weekly analysis

Shares of Berkshire Hathaway Inc. (BRK.B) are trading near $503 and remain under pressure after another lackluster week. The daily chart shows mixed signals as sellers dominate, with momentum lacking clear direction and technical indicators pointing to continued short-term uncertainty. The coming week will hinge on whether these oversold conditions draw fresh buyers or further downside develops.
 559.58
Highlights
- Shares of Berkshire Hathaway edged lower over the past week but maintain a bullish long-term structure above key moving averages.
- The daily trend remains uncertain as the stock consolidates near the lower end of its weekly range with mixed momentum signals.
- Key support is at $499.62 and resistance is at $508.89, with a projected range of $495.47 to $510.06 for the coming week.
Alphabet stake expansion and record buybacks support sentiment this week
Berkshire Hathaway reported a major increase in its Alphabet holdings during the second quarter of 2026, raising its stake by 83% to about 106 million shares valued at $37.9 billion, according to CNBC and AP News. The company executed $4.5 billion in share buybacks in Q2, its highest pace since 2021, and repurchased another $3.3 billion in July, tightening supply and supporting sentiment. Additional developments included trimming Bank of America, expanding into Delta Air Lines and homebuilders, a record insurance float, lower underwriting profit, and the formal appointment of Greg Abel as CEO in 2026, with several institutions also increasing their stakes in BRK.B during the quarter.
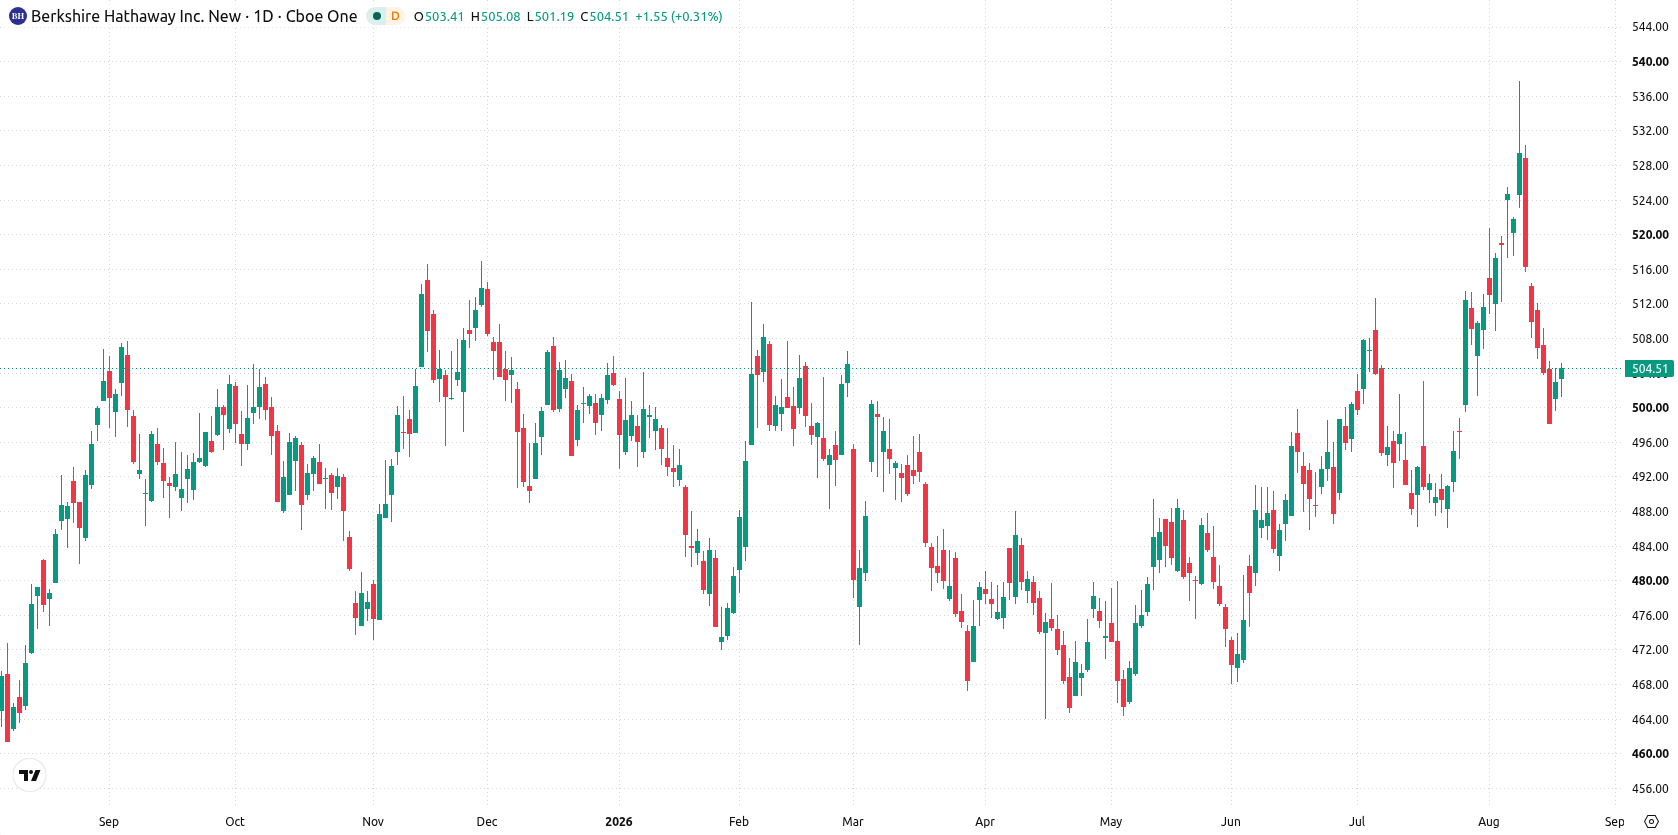
Neutral RSI and oversold Stoch RSI flag consolidation after weekly volatility
On the daily chart, a developing trend points to uncertainty, with Berkshire Hathaway consolidating in the lower part of its weekly range and recent volatility at 3.27%. While RSI is neutral at 47.39, the Stoch RSI has entered the oversold zone, suggesting short-term selling pressure that has not yet become decisive. MACD maintains a buy direction, indicating that momentum signals are mixed and no clear daily trend has emerged. Key levels to watch are support at $499.62 and resistance at $508.89, with the Ichimoku Kijun at $511.9 providing an additional barrier on the upside.
Probability favors near-range hold as breakout triggers watched next week
Next week, the expected range is $495.47 to $510.06, with a 68% probability of an increase and a 32% probability of a decrease. The base case sees the stock holding between $499.62 and $508.89 as the emerging move lower seeks further confirmation. A close above $508.89 and the Kijun at $511.9 would signal possible upside momentum. Weakness below support at $499.62 could see a test of the $495.47 area.
Earlier, analysts noted that Berkshire Hathaway’s diversified strategy and focus on capital deployment have helped it navigate shifting market conditions. The current technical landscape introduces new short-term risks, making support at $499.62 a key level for traders to monitor for any decisive move.






Latest Berkshire Hathaway News





-
 Afghanistan
-
 Albania
-
 Algeria
-
 Angola
-
 Argentina
-
 Armenia
-
 Australia
-
 Austria
-
 Azerbaijan
-
 Bahamas
-
 Bahrain
-
 Bangladesh
-
 Belarus
-
 Belgium
-
 Bolivia
-
 Botswana
-
 Brazil
-
 Brunei
-
 Bulgaria
-
 Cambodia
-
 Cameroon
-
 Canada
-
 Chile
-
 China
-
 Colombia
-
 Congo
-
 Costa Rica
-
 Cote d'Ivoire
-
 Croatia
-
 Cuba
-
 Cyprus
-
 Czechia
-
 DR Congo
-
 Denmark
-
 Dominican Republic
-
 Ecuador
-
 Egypt
-
 El Salvador
-
 Estonia
-
 Eswatini
-
 Ethiopia
-
 Finland
-
 France
-
 Georgia
-
 Germany
-
 Ghana
-
 Greece
-
 Haiti
-
 Hong Kong
-
 Hungary
-
 India
-
 Indonesia
-
 Iran, Islamic republic
-
 Iraq
-
 Ireland
-
 Israel
-
 Italy
-
 Jamaica
-
 Japan
-
 Jordan
-
 Kazakhstan
-
 Kenya
-
 Korea
-
 Kuwait
-
 Kyrgyzstan
-
 Laos
-
 Latvia
-
 Lebanon
-
 Lesotho
-
 Libya
-
 Lithuania
-
 Luxembourg
-
 Madagascar
-
 Malaysia
-
 Malta
-
 Mauritius
-
 Mexico
-
 Moldova
-
 Mongolia
-
 Montenegro
-
 Morocco
-
 Mozambique
-
 Myanmar
-
 Namibia
-
 Nepal
-
 Netherlands
-
 New Zealand
-
 Nigeria
-
 North Macedonia
-
 Norway
-
 Oman
-
 Pakistan
-
 Palestine
-
 Panama
-
 Papua New Guinea
-
 Paraguay
-
 Peru
-
 Philippines
-
 Poland
-
 Portugal
-
 Puerto Rico
-
 Qatar
-
 Reunion
-
 Romania
-
 Rwanda
-
 Saudi Arabia
-
 Serbia
-
 Singapore
-
 Slovakia
-
 Slovenia
-
 Somalia
-
 South Africa
-
 Spain
-
 Sri Lanka
-
 Sweden
-
 Switzerland
-
 Syria
-
 Taiwan
-
 Tajikistan
-
 Tanzania
-
 Thailand
-
 Trinidad and Tobago
-
 Tunisia
-
 Turkey
-
 UAE
-
 Uganda
-
 Ukraine
-
 United Kingdom
-
United States
-
 Uruguay
-
 Uzbekistan
-
 Venezuela
-
 Vietnam
-
 Yemen
-
 Zambia
-
 Zimbabwe
- Forex
- Crypto












