

Broadcom stock price prediction: Support test after Marvell Technology custom silicon deal with Google

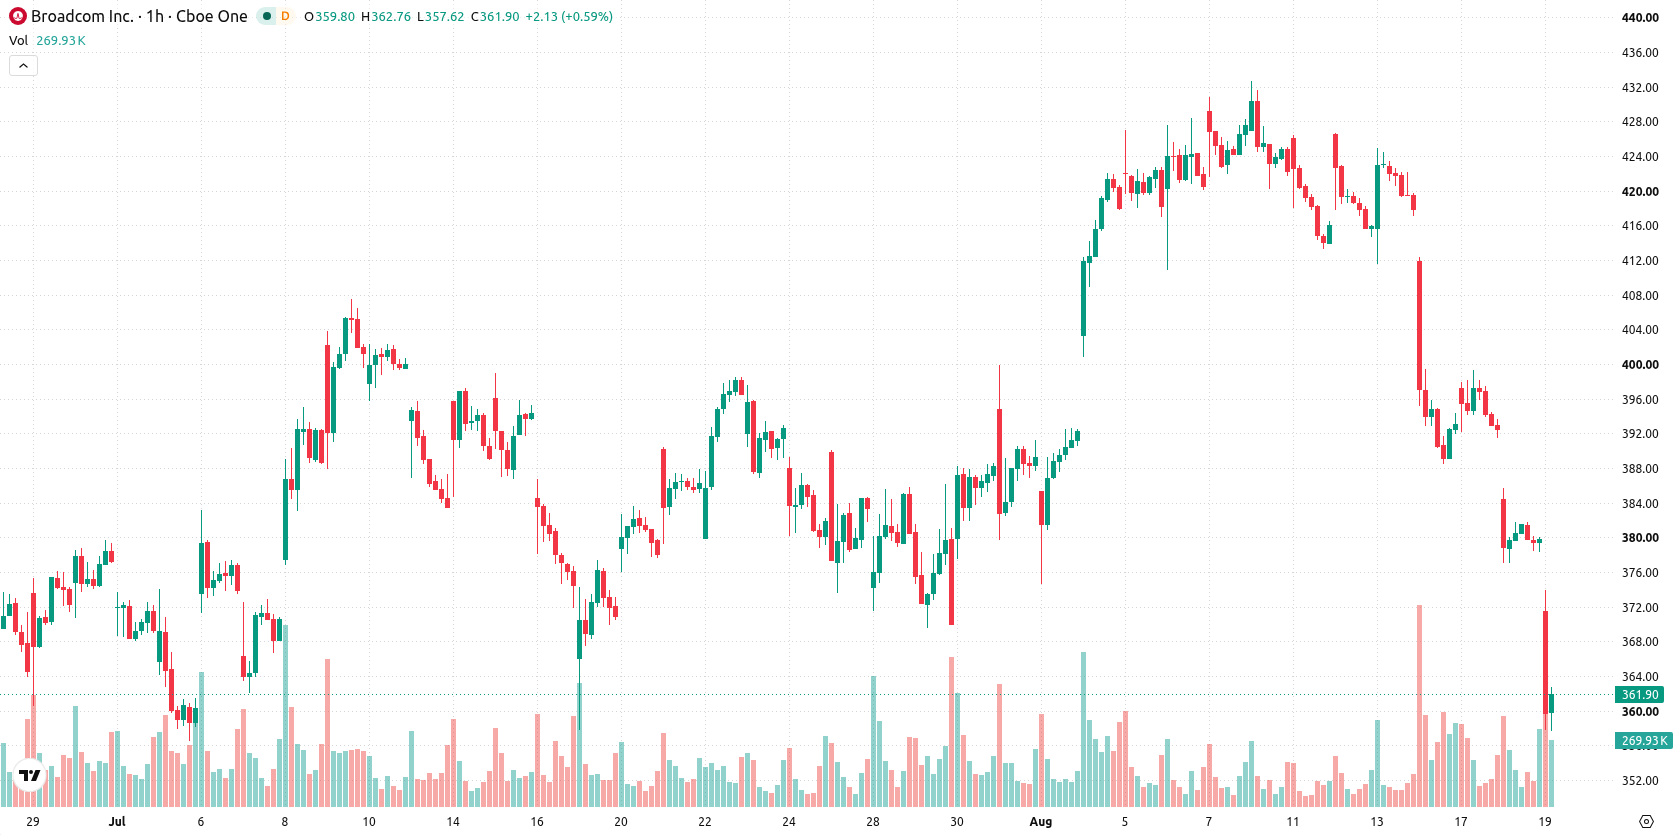
Broadcom (AVGO) stock is trading at $362.15, down 4.58% on the day and notably below its key moving averages. The shares remain under near-term and longer-term pressure as they move further away from established support levels.
 351.95
Highlights
- Marvell Technology's new custom silicon agreement with Google has raised competitive risk for Broadcom's core chip segment.
- Valuation concerns, institutional selling, and worries about peaking AI investments have reduced demand for Broadcom shares.
- Shares of Broadcom trade below key moving averages with negative momentum indicators, projecting a likely range of $340.75 to $383.55 and a 78% probability of further downside.
Competitive threats and AI cycle fears stoke institutional selling
The recent custom silicon agreement between Marvell Technology and Google has intensified competitive pressure on Broadcom's core chip business, causing a reassessment of future demand for its products, according to Tradingkey. Additional headwinds have arisen from institutional selling, valuation concerns, and apprehension over a potential peak in the AI investment cycle, diminishing investor appetite for Broadcom shares, as reported by Quiverquant. The stock has also faced bouts of volatility tied to reported VMware security vulnerabilities and regulatory scrutiny of its AI financing structures, contributing to market uncertainty and compounding the broader decline, as noted by Fxleaders.
Oversold signals persist as momentum and support erode
Technically, AVGO is trading below its MA-20 at $385.39, MA-50 at $404.62, and MA-200 at $369.21 on the H1 chart. Immediate resistance is defined by the Ichimoku Kijun level at $389.96. Momentum gauges such as MACD and ADX both indicate a sell signal. RSI, Stochastic RSI, CCI, and Bull/Bear Power each reflect strong oversold conditions and seller dominance, while the Awesome Oscillator corroborates the prevailing downtrend. There are no positive divergences across oscillators, with moderate volatility observed as the price holds near today's high following a sharp decline and gap from the previous session.
Downside risk prevails as recovery hinges on resistance break
Looking to the short-term, AVGO is expected to consolidate within a volatility band of $340.75 to $383.55. The probability of an upward move is calculated at 22%, while downside risk has a higher likelihood at 78%. A bullish breakout above resistance would be required to trigger any recovery attempts, whereas a sustained move below support could accelerate renewed selling.
Previously it was reported that Broadcom faced heightened pressure from institutional selling, credit concerns, and uncertainty surrounding its AI chip financing, leading to a bearish outlook. The current analysis adds intensifying competitive risks and confirms that downside risk remains elevated, making it essential for traders to closely monitor any price action near the $340.75 support level for signs of further selling or potential stabilization.









-
 Afghanistan
-
 Albania
-
 Algeria
-
 Angola
-
 Argentina
-
 Armenia
-
 Australia
-
 Austria
-
 Azerbaijan
-
 Bahamas
-
 Bahrain
-
 Bangladesh
-
 Belarus
-
 Belgium
-
 Bolivia
-
 Botswana
-
 Brazil
-
 Brunei
-
 Bulgaria
-
 Cambodia
-
 Cameroon
-
 Canada
-
 Chile
-
 China
-
 Colombia
-
 Congo
-
 Costa Rica
-
 Cote d'Ivoire
-
 Croatia
-
 Cuba
-
 Cyprus
-
 Czechia
-
 DR Congo
-
 Denmark
-
 Dominican Republic
-
 Ecuador
-
 Egypt
-
 El Salvador
-
 Estonia
-
 Eswatini
-
 Ethiopia
-
 Finland
-
 France
-
 Georgia
-
 Germany
-
 Ghana
-
 Greece
-
 Haiti
-
 Hong Kong
-
 Hungary
-
 India
-
 Indonesia
-
 Iran, Islamic republic
-
 Iraq
-
 Ireland
-
 Israel
-
 Italy
-
 Jamaica
-
 Japan
-
 Jordan
-
 Kazakhstan
-
 Kenya
-
 Korea
-
 Kuwait
-
 Kyrgyzstan
-
 Laos
-
 Latvia
-
 Lebanon
-
 Lesotho
-
 Libya
-
 Lithuania
-
 Luxembourg
-
 Madagascar
-
 Malaysia
-
 Malta
-
 Mauritius
-
 Mexico
-
 Moldova
-
 Mongolia
-
 Montenegro
-
 Morocco
-
 Mozambique
-
 Myanmar
-
 Namibia
-
 Nepal
-
 Netherlands
-
 New Zealand
-
 Nigeria
-
 North Macedonia
-
 Norway
-
 Oman
-
 Pakistan
-
 Palestine
-
 Panama
-
 Papua New Guinea
-
 Paraguay
-
 Peru
-
 Philippines
-
 Poland
-
 Portugal
-
 Puerto Rico
-
 Qatar
-
 Reunion
-
 Romania
-
 Rwanda
-
 Saudi Arabia
-
 Serbia
-
 Singapore
-
 Slovakia
-
 Slovenia
-
 Somalia
-
 South Africa
-
 Spain
-
 Sri Lanka
-
 Sweden
-
 Switzerland
-
 Syria
-
 Taiwan
-
 Tajikistan
-
 Tanzania
-
 Thailand
-
 Trinidad and Tobago
-
 Tunisia
-
 Turkey
-
 UAE
-
 Uganda
-
 Ukraine
-
 United Kingdom
-
United States
-
 Uruguay
-
 Uzbekistan
-
 Venezuela
-
 Vietnam
-
 Yemen
-
 Zambia
-
 Zimbabwe
- Forex
- Crypto












