


The J. M. Smucker Company (SJM) advanced 3.37% as investors positioned ahead of its upcoming first quarter fiscal 2026 earnings, drawing buying interest on expectations for earnings momentum. The uptick is supported by strong technical signals, with JM Smucker trading above its short-, medium-, and long-term moving averages.
 131.85
136.05
Highlights
- JM Smucker will report first quarter fiscal 2026 earnings on August 26, 2024 with a market cap of $12.66 billion.
- Recent market discussion focuses on whether earnings momentum will match the recent valuation adjustment for the stock.
- Shares of JM Smucker trade near $122.49 with strong short- and long-term bullish momentum and a five-day expected range of $120.53 to $124.64.
Valuation concerns emerge as earnings momentum faces scrutiny
JM Smucker is preparing to announce its first quarter fiscal 2026 earnings on August 26, 2024, before the market opens. The company maintains a market capitalization of approximately $12.66 billion. Recent commentary has centered on whether earnings momentum will keep pace with a recent valuation adjustment.
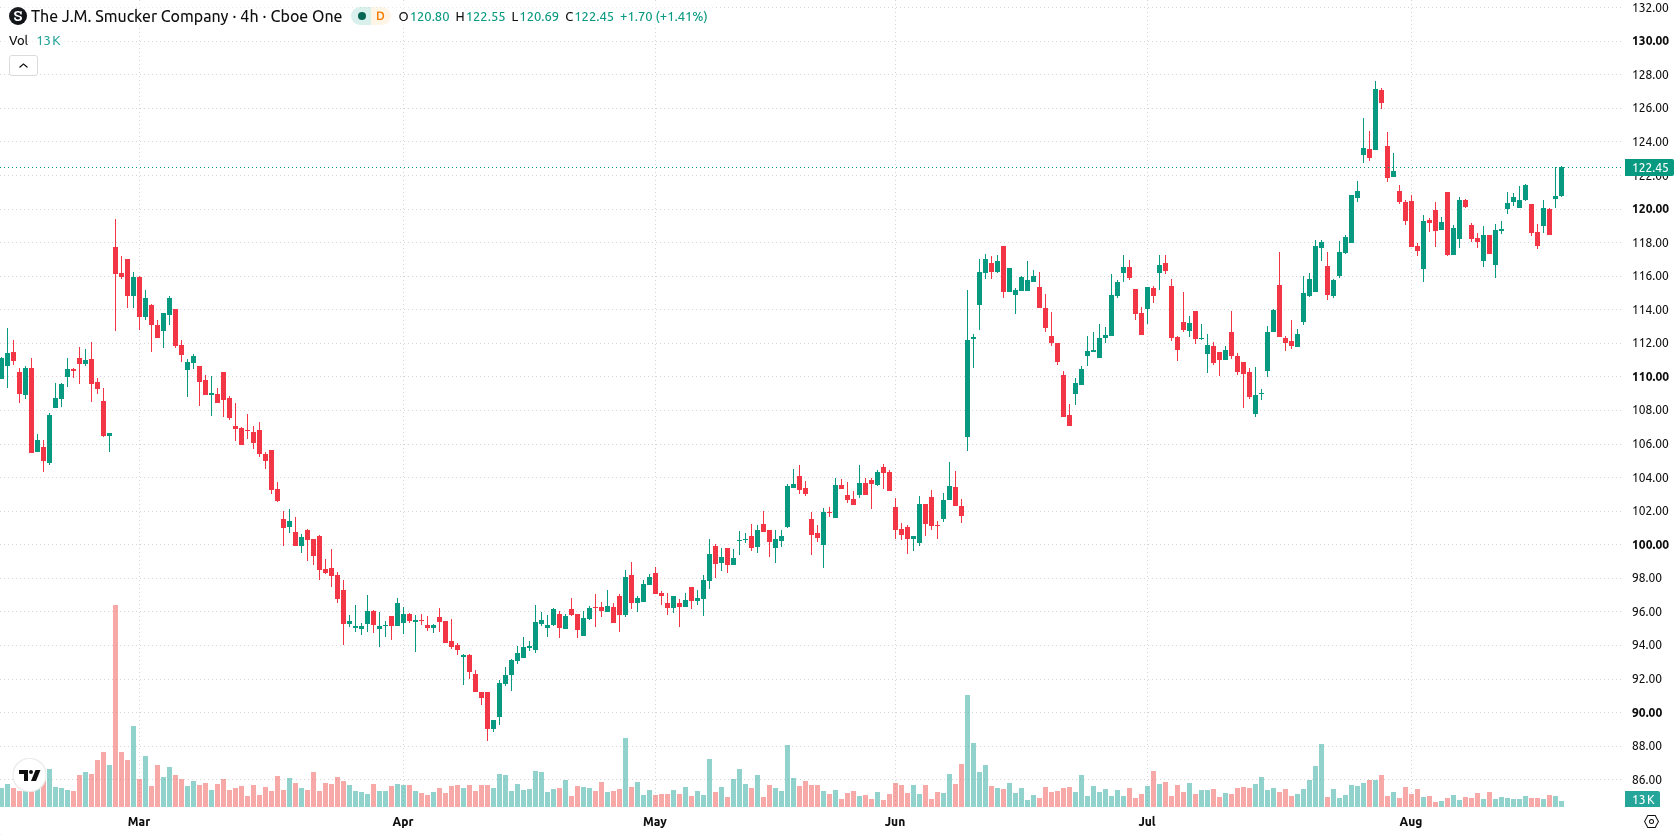
Bullish trend strength confirmed as technical signals diverge
JM Smucker is trading above its 20-day, 50-day, and 200-day moving averages ($119.57, $115.42, and $105.4), signaling bullish momentum across short, medium, and long timeframes. Near-term levels to watch are resistance at $122.5 and support at $121.46, with a bullish long-term alignment confirmed by the positioning of the 50- and 200-day averages. Momentum readings are constructive: the Moving Average Convergence Divergence (MACD) supports a strong buy view, while the Average Directional Index (ADX) remains neutral. The Relative Strength Index (RSI) sits at 52 (buy), the Stochastic RSI shows oversold conditions, and the Commodity Channel Index (CCI) is neutral. Bull/Bear Power (BBP) at 1.58 signals buyers dominate intraday action, although it flags an overbought condition. The Awesome Oscillator (AO) backs the current upward trend. The stock is near today's high, and intraday volatility stands at 2.12%. Strong performance toward session highs is broadly supported by momentum signals, though the mix of overbought and oversold oscillators suggests some underlying divergence.
Earlier, analysts noted that JM Smucker maintained strong technical momentum, with sustained buying pressure reinforcing its bullish trend. The current setup adds a new dimension as oscillators now signal some divergence; traders should closely monitor the $122.5 resistance, as a break above could target the upper forecast range.






Latest JM Smucker Company News




-
 Afghanistan
-
 Albania
-
 Algeria
-
 Angola
-
 Argentina
-
 Armenia
-
 Australia
-
 Austria
-
 Azerbaijan
-
 Bahamas
-
 Bahrain
-
 Bangladesh
-
 Belarus
-
 Belgium
-
 Bolivia
-
 Botswana
-
 Brazil
-
 Brunei
-
 Bulgaria
-
 Cambodia
-
 Cameroon
-
 Canada
-
 Chile
-
 China
-
 Colombia
-
 Congo
-
 Costa Rica
-
 Cote d'Ivoire
-
 Croatia
-
 Cuba
-
 Cyprus
-
 Czechia
-
 DR Congo
-
 Denmark
-
 Dominican Republic
-
 Ecuador
-
 Egypt
-
 El Salvador
-
 Estonia
-
 Eswatini
-
 Ethiopia
-
 Finland
-
 France
-
 Georgia
-
 Germany
-
 Ghana
-
 Greece
-
 Haiti
-
 Hong Kong
-
 Hungary
-
 India
-
 Indonesia
-
 Iran, Islamic republic
-
 Iraq
-
 Ireland
-
 Israel
-
 Italy
-
 Jamaica
-
 Japan
-
 Jordan
-
 Kazakhstan
-
 Kenya
-
 Korea
-
 Kuwait
-
 Kyrgyzstan
-
 Laos
-
 Latvia
-
 Lebanon
-
 Lesotho
-
 Libya
-
 Lithuania
-
 Luxembourg
-
 Madagascar
-
 Malaysia
-
 Malta
-
 Mauritius
-
 Mexico
-
 Moldova
-
 Mongolia
-
 Montenegro
-
 Morocco
-
 Mozambique
-
 Myanmar
-
 Namibia
-
 Nepal
-
 Netherlands
-
 New Zealand
-
 Nigeria
-
 North Macedonia
-
 Norway
-
 Oman
-
 Pakistan
-
 Palestine
-
 Panama
-
 Papua New Guinea
-
 Paraguay
-
 Peru
-
 Philippines
-
 Poland
-
 Portugal
-
 Puerto Rico
-
 Qatar
-
 Reunion
-
 Romania
-
 Rwanda
-
 Saudi Arabia
-
 Serbia
-
 Singapore
-
 Slovakia
-
 Slovenia
-
 Somalia
-
 South Africa
-
 Spain
-
 Sri Lanka
-
 Sweden
-
 Switzerland
-
 Syria
-
 Taiwan
-
 Tajikistan
-
 Tanzania
-
 Thailand
-
 Trinidad and Tobago
-
 Tunisia
-
 Turkey
-
 UAE
-
 Uganda
-
 Ukraine
-
 United Kingdom
-
United States
-
 Uruguay
-
 Uzbekistan
-
 Venezuela
-
 Vietnam
-
 Yemen
-
 Zambia
-
 Zimbabwe
- Forex
- Crypto












