

JM Smucker stock gains more than 3% after bullish signals dominate trading action

The J. M. Smucker Company (SJM) surged 3.33% today as strong technical momentum and sustained buying pressure drove the stock higher. Bullish signals from moving averages and a series of overbought indicators support the strength of the move across time frames.
 132.83
134.13
Highlights
- JM Smucker shows sustained bullish momentum, trading above all major moving averages and near session highs.
- Momentum indicators are overbought and intraday action is dominated by buyers, indicating stretched but strong upside.
- Projected five-day price range is $121.56 to $129.82, with over 80% probability of further upside barring a reversal below $121.56.
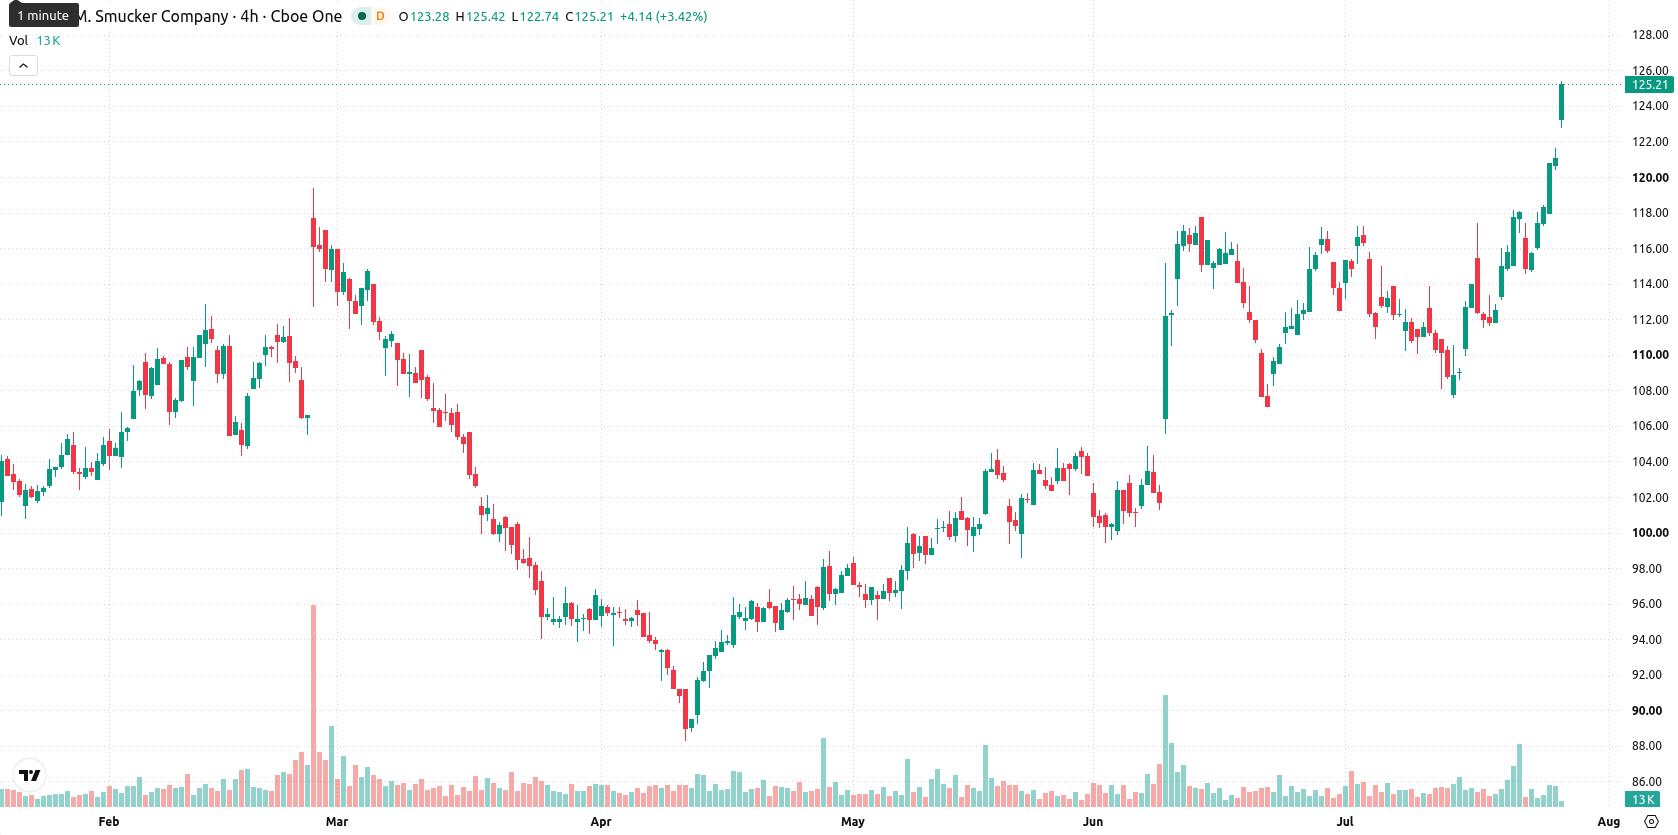
Overbought signals intensify as price exceeds technical benchmarks
JM Smucker is trading above its 20-day, 50-day, and 200-day moving averages at $113.75, $109.71, and $104.13, respectively, signaling bullish momentum across all time frames. The prevailing trend remains supported by the Ichimoku Kijun at $114.35, with the nearest support at $121.97 and resistance at $125.42. Momentum signals are robust, with MACD in a buy phase and ADX at a neutral 17.24, suggesting moderate trend strength. RSI stands at 64.78 with a buy forecast. Stochastic RSI, CCI, and BBP are all firmly overbought, clearly indicating that buyers dominate intraday action. The Awesome Oscillator aligns with this bullish trend. The stock is up $4.03 or 3.33% on the day, opening with an upside gap of $0.92 (0.76%), and is trading near its session high with intraday volatility at 2.83%. Short-term oscillators indicate strong, but stretched, momentum toward the highs.
Earlier, analysts noted that JM Smucker maintained a bullish technical profile despite episodes of selling pressure. The latest surge in buying interest reinforces the uptrend, but with momentum indicators now firmly overbought, traders should watch for potential volatility if the stock tests or exceeds the upper limit of its projected range.






Latest JM Smucker Company News




-
 Afghanistan
-
 Albania
-
 Algeria
-
 Angola
-
 Argentina
-
 Armenia
-
 Australia
-
 Austria
-
 Azerbaijan
-
 Bahamas
-
 Bahrain
-
 Bangladesh
-
 Belarus
-
 Belgium
-
 Bolivia
-
 Botswana
-
 Brazil
-
 Brunei
-
 Bulgaria
-
 Cambodia
-
 Cameroon
-
 Canada
-
 Chile
-
 China
-
 Colombia
-
 Congo
-
 Costa Rica
-
 Cote d'Ivoire
-
 Croatia
-
 Cuba
-
 Cyprus
-
 Czechia
-
 DR Congo
-
 Denmark
-
 Dominican Republic
-
 Ecuador
-
 Egypt
-
 El Salvador
-
 Estonia
-
 Eswatini
-
 Ethiopia
-
 Finland
-
 France
-
 Georgia
-
 Germany
-
 Ghana
-
 Greece
-
 Haiti
-
 Hong Kong
-
 Hungary
-
 India
-
 Indonesia
-
 Iran, Islamic republic
-
 Iraq
-
 Ireland
-
 Israel
-
 Italy
-
 Jamaica
-
 Japan
-
 Jordan
-
 Kazakhstan
-
 Kenya
-
 Korea
-
 Kuwait
-
 Kyrgyzstan
-
 Laos
-
 Latvia
-
 Lebanon
-
 Lesotho
-
 Libya
-
 Lithuania
-
 Luxembourg
-
 Madagascar
-
 Malaysia
-
 Malta
-
 Mauritius
-
 Mexico
-
 Moldova
-
 Mongolia
-
 Montenegro
-
 Morocco
-
 Mozambique
-
 Myanmar
-
 Namibia
-
 Nepal
-
 Netherlands
-
 New Zealand
-
 Nigeria
-
 North Macedonia
-
 Norway
-
 Oman
-
 Pakistan
-
 Palestine
-
 Panama
-
 Papua New Guinea
-
 Paraguay
-
 Peru
-
 Philippines
-
 Poland
-
 Portugal
-
 Puerto Rico
-
 Qatar
-
 Reunion
-
 Romania
-
 Rwanda
-
 Saudi Arabia
-
 Serbia
-
 Singapore
-
 Slovakia
-
 Slovenia
-
 Somalia
-
 South Africa
-
 Spain
-
 Sri Lanka
-
 Sweden
-
 Switzerland
-
 Syria
-
 Taiwan
-
 Tajikistan
-
 Tanzania
-
 Thailand
-
 Trinidad and Tobago
-
 Tunisia
-
 Turkey
-
 UAE
-
 Uganda
-
 Ukraine
-
 United Kingdom
-
United States
-
 Uruguay
-
 Uzbekistan
-
 Venezuela
-
 Vietnam
-
 Yemen
-
 Zambia
-
 Zimbabwe
- Forex
- Crypto












