

Why is Reckitt Benckiser stock flat today? Key resistance levels in focus

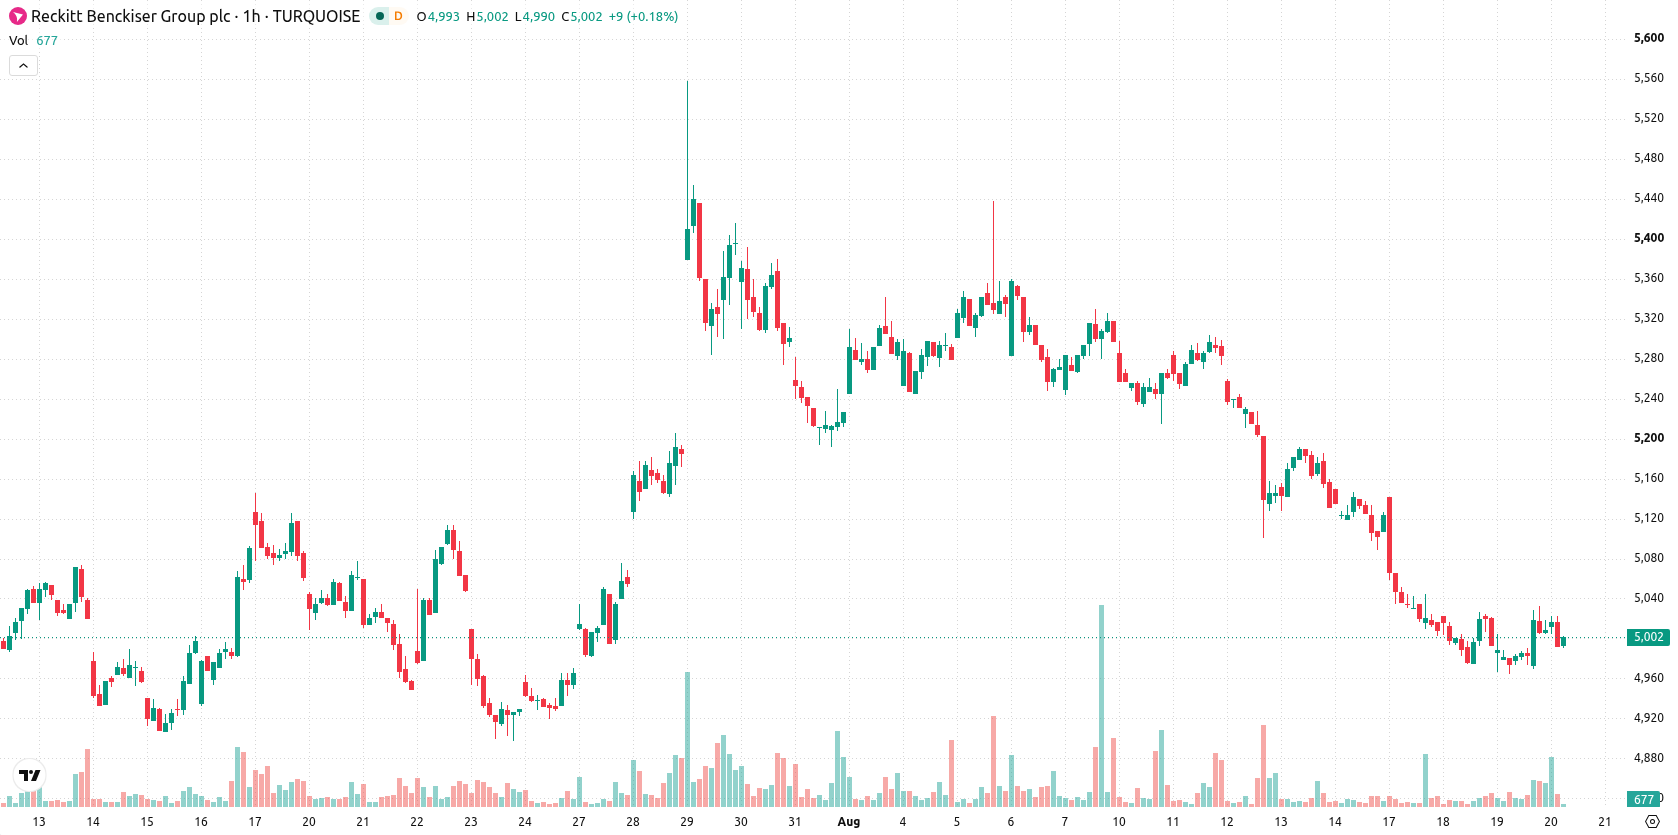
Reckitt Benckiser (RKT) stock is trading at GBX5,006, posting a modest day gain. The price stands above its key short-term moving averages, while daily volatility has remained low.
 5716.00
5728.00
Highlights
- RKT/GBX trades above its short-term moving average but below medium- and long-term trends, confirming short-term outperformance within broader weakness.
- Technical indicator signals conflict, with momentum largely negative and oscillators diverging; buyers show intraday strength but trend direction remains contested.
- Price is expected to move sideways between GBX4,909 and GBX5,102, with a very high probability of a downward move and limited chance of reversal.
Mixed momentum signals as price holds between moving averages
On the technical side, RKT’s current price is above the MA-20 at GBX4,995 but remains below the MA-50 (GBX5,058) and MA-200 (GBX5,453). The Ichimoku Kijun at GBX5,030 serves as immediate resistance. Momentum indicators show mixed conditions: MACD stands at Strong Sell, ADX is Neutral, and RSI reads 45.77 (Sell), while CCI indicates Buy and Stochastic RSI is Overbought. Bull/Bear Power points to intraday buyer strength and the Awesome Oscillator is Neutral, reflecting divergent momentum signals.
Downside risk dominates as range-bound action persists
In the short term, price action for RKT is likely to remain contained within the GBX4,909 to GBX5,102 range, corresponding to the established volatility band. The probability of a sustained upward move is considered very low, while a downward move is viewed as very highly probable. The baseline scenario favors sideways movement within this zone; to shift bullish, the price would need a definitive close above resistance at GBX5,030, while a drop below GBX4,909 would reinforce the bearish scenario.
Earlier, analysts noted that Reckitt Benckiser faced continued downside risk, with technical signals at that time supporting a cautious outlook. The current analysis confirms this view, suggesting that traders should monitor the GBX5,030 resistance closely for any signs of a potential upward reversal.











-
 Afghanistan
-
 Albania
-
 Algeria
-
 Angola
-
 Argentina
-
 Armenia
-
 Australia
-
 Austria
-
 Azerbaijan
-
 Bahamas
-
 Bahrain
-
 Bangladesh
-
 Belarus
-
 Belgium
-
 Bolivia
-
 Botswana
-
 Brazil
-
 Brunei
-
 Bulgaria
-
 Cambodia
-
 Cameroon
-
 Canada
-
 Chile
-
 China
-
 Colombia
-
 Congo
-
 Costa Rica
-
 Cote d'Ivoire
-
 Croatia
-
 Cuba
-
 Cyprus
-
 Czechia
-
 DR Congo
-
 Denmark
-
 Dominican Republic
-
 Ecuador
-
 Egypt
-
 El Salvador
-
 Estonia
-
 Eswatini
-
 Ethiopia
-
 Finland
-
 France
-
 Georgia
-
 Germany
-
 Ghana
-
 Greece
-
 Haiti
-
 Hong Kong
-
 Hungary
-
 India
-
 Indonesia
-
 Iran, Islamic republic
-
 Iraq
-
 Ireland
-
 Israel
-
 Italy
-
 Jamaica
-
 Japan
-
 Jordan
-
 Kazakhstan
-
 Kenya
-
 Korea
-
 Kuwait
-
 Kyrgyzstan
-
 Laos
-
 Latvia
-
 Lebanon
-
 Lesotho
-
 Libya
-
 Lithuania
-
 Luxembourg
-
 Madagascar
-
 Malaysia
-
 Malta
-
 Mauritius
-
 Mexico
-
 Moldova
-
 Mongolia
-
 Montenegro
-
 Morocco
-
 Mozambique
-
 Myanmar
-
 Namibia
-
 Nepal
-
 Netherlands
-
 New Zealand
-
 Nigeria
-
 North Macedonia
-
 Norway
-
 Oman
-
 Pakistan
-
 Palestine
-
 Panama
-
 Papua New Guinea
-
 Paraguay
-
 Peru
-
 Philippines
-
 Poland
-
 Portugal
-
 Puerto Rico
-
 Qatar
-
 Reunion
-
 Romania
-
 Rwanda
-
 Saudi Arabia
-
 Serbia
-
 Singapore
-
 Slovakia
-
 Slovenia
-
 Somalia
-
 South Africa
-
 Spain
-
 Sri Lanka
-
 Sweden
-
 Switzerland
-
 Syria
-
 Taiwan
-
 Tajikistan
-
 Tanzania
-
 Thailand
-
 Trinidad and Tobago
-
 Tunisia
-
 Turkey
-
 UAE
-
 Uganda
-
 Ukraine
-
 United Kingdom
-
United States
-
 Uruguay
-
 Uzbekistan
-
 Venezuela
-
 Vietnam
-
 Yemen
-
 Zambia
-
 Zimbabwe
- Forex
- Crypto












