

PepsiCo shares approach key resistance as overbought readings signal cautious outlook: weekly analysis

Shares of PepsiCo, Inc. (PEP) are trading near $142 following a recovery of just over 1% over the past week, as the chart shows momentum stabilizing but technical signals flashing overbought conditions. The setup remains stretched, with limited upside suggested for the coming days as buyers face resistance at higher levels.
 142.08
145.50
Highlights
- Shares of PepsiCo have risen 1.08% over the past week, consolidating above short-term moving averages with resistance at $143.61.
- Technical indicators place PepsiCo stock firmly in the overbought zone, with stretched conditions and limited immediate upside expected.
- Consensus range for the week ahead is $138.9 to $144.84, with base case consolidation between $140.08 and $143.61.
Dividend hike and earnings miss shape sentiment alongside AI initiatives
PepsiCo reported mixed second-quarter results, with revenue increasing but earnings falling short of analyst expectations, according to Yahoo Finance and Kalkine Media. The company extended its long history of dividend growth by approving a 4% dividend hike for 2026 to $5.92 per share, further highlighted by Yahoo Finance and 24/7 Wall St, while its dividend yield reached a multi-decade high. PEP has also begun using AI-driven marketing initiatives and cut prices in North America after prolonged volume declines, and released its 2025 ESG Summary outlining sustainability progress, as noted by ad-hoc-news.de, BigGo Finance, and 3blmedia.com.
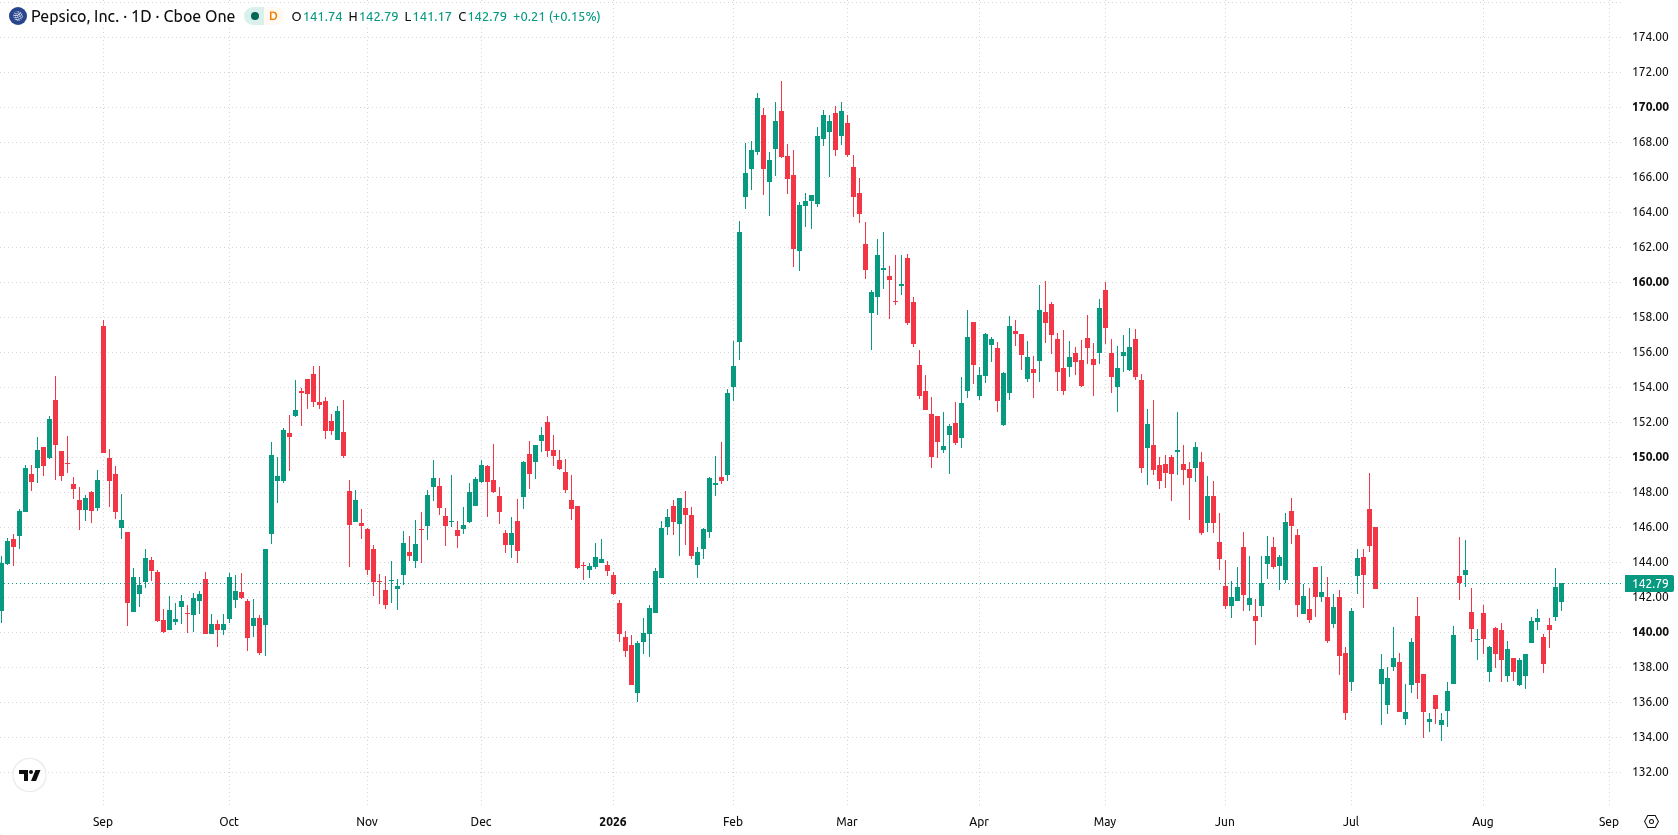
Overbought readings persist as price stabilizes near support and resistance
The daily chart shows PepsiCo stabilising above its MA-20 and MA-50, with the HMA turning bullish and the Stochastic RSI reading of 100 indicating the shares are firmly in the overbought zone. Bull/Bear Power also supports an overbought condition, suggesting recent gains have moved into stretched territory, while volatility over the past week stands at 4.32%. Support is found near $140.08 (MA-50) and the Ichimoku Kijun at $139.58, while resistance is set at $143.61, the recent weekly high. Momentum character points to a contained move within a narrow range, signalling limited room for further upside in the immediate term.
Consolidation likely as upside limited barring breakout above resistance
In the week ahead, expect the stock to trade between $138.9 and $144.84. There is a 58% probability of an increase and a 42% probability of a decrease. The base case is continued consolidation between $140.08 and $143.61. A bullish scenario would see a convincing move above $143.61, opening the way to the upper end of the expected range. Conversely, a drop below $140.08 would bring the $138.9 area into view and validate the provider’s directional bias to the downside.
Earlier, analysts noted that PepsiCo shares were locked in a tight consolidation phase with prevailing downside risk as technical indicators signaled a bearish tilt. The current price action reflects a short-term shift, with upward momentum now constrained by overbought signals and key resistance at $143.61 serving as the critical level to watch for a potential breakout or renewed pullback.









-
 Afghanistan
-
 Albania
-
 Algeria
-
 Angola
-
 Argentina
-
 Armenia
-
 Australia
-
 Austria
-
 Azerbaijan
-
 Bahamas
-
 Bahrain
-
 Bangladesh
-
 Belarus
-
 Belgium
-
 Bolivia
-
 Botswana
-
 Brazil
-
 Brunei
-
 Bulgaria
-
 Cambodia
-
 Cameroon
-
 Canada
-
 Chile
-
 China
-
 Colombia
-
 Congo
-
 Costa Rica
-
 Cote d'Ivoire
-
 Croatia
-
 Cuba
-
 Cyprus
-
 Czechia
-
 DR Congo
-
 Denmark
-
 Dominican Republic
-
 Ecuador
-
 Egypt
-
 El Salvador
-
 Estonia
-
 Eswatini
-
 Ethiopia
-
 Finland
-
 France
-
 Georgia
-
 Germany
-
 Ghana
-
 Greece
-
 Haiti
-
 Hong Kong
-
 Hungary
-
 India
-
 Indonesia
-
 Iran, Islamic republic
-
 Iraq
-
 Ireland
-
 Israel
-
 Italy
-
 Jamaica
-
 Japan
-
 Jordan
-
 Kazakhstan
-
 Kenya
-
 Korea
-
 Kuwait
-
 Kyrgyzstan
-
 Laos
-
 Latvia
-
 Lebanon
-
 Lesotho
-
 Libya
-
 Lithuania
-
 Luxembourg
-
 Madagascar
-
 Malaysia
-
 Malta
-
 Mauritius
-
 Mexico
-
 Moldova
-
 Mongolia
-
 Montenegro
-
 Morocco
-
 Mozambique
-
 Myanmar
-
 Namibia
-
 Nepal
-
 Netherlands
-
 New Zealand
-
 Nigeria
-
 North Macedonia
-
 Norway
-
 Oman
-
 Pakistan
-
 Palestine
-
 Panama
-
 Papua New Guinea
-
 Paraguay
-
 Peru
-
 Philippines
-
 Poland
-
 Portugal
-
 Puerto Rico
-
 Qatar
-
 Reunion
-
 Romania
-
 Rwanda
-
 Saudi Arabia
-
 Serbia
-
 Singapore
-
 Slovakia
-
 Slovenia
-
 Somalia
-
 South Africa
-
 Spain
-
 Sri Lanka
-
 Sweden
-
 Switzerland
-
 Syria
-
 Taiwan
-
 Tajikistan
-
 Tanzania
-
 Thailand
-
 Trinidad and Tobago
-
 Tunisia
-
 Turkey
-
 UAE
-
 Uganda
-
 Ukraine
-
 United Kingdom
-
United States
-
 Uruguay
-
 Uzbekistan
-
 Venezuela
-
 Vietnam
-
 Yemen
-
 Zambia
-
 Zimbabwe
- Forex
- Crypto












