

Why is Bit Digital stock up today? Strong rally faces $1.81 resistance levels in focus

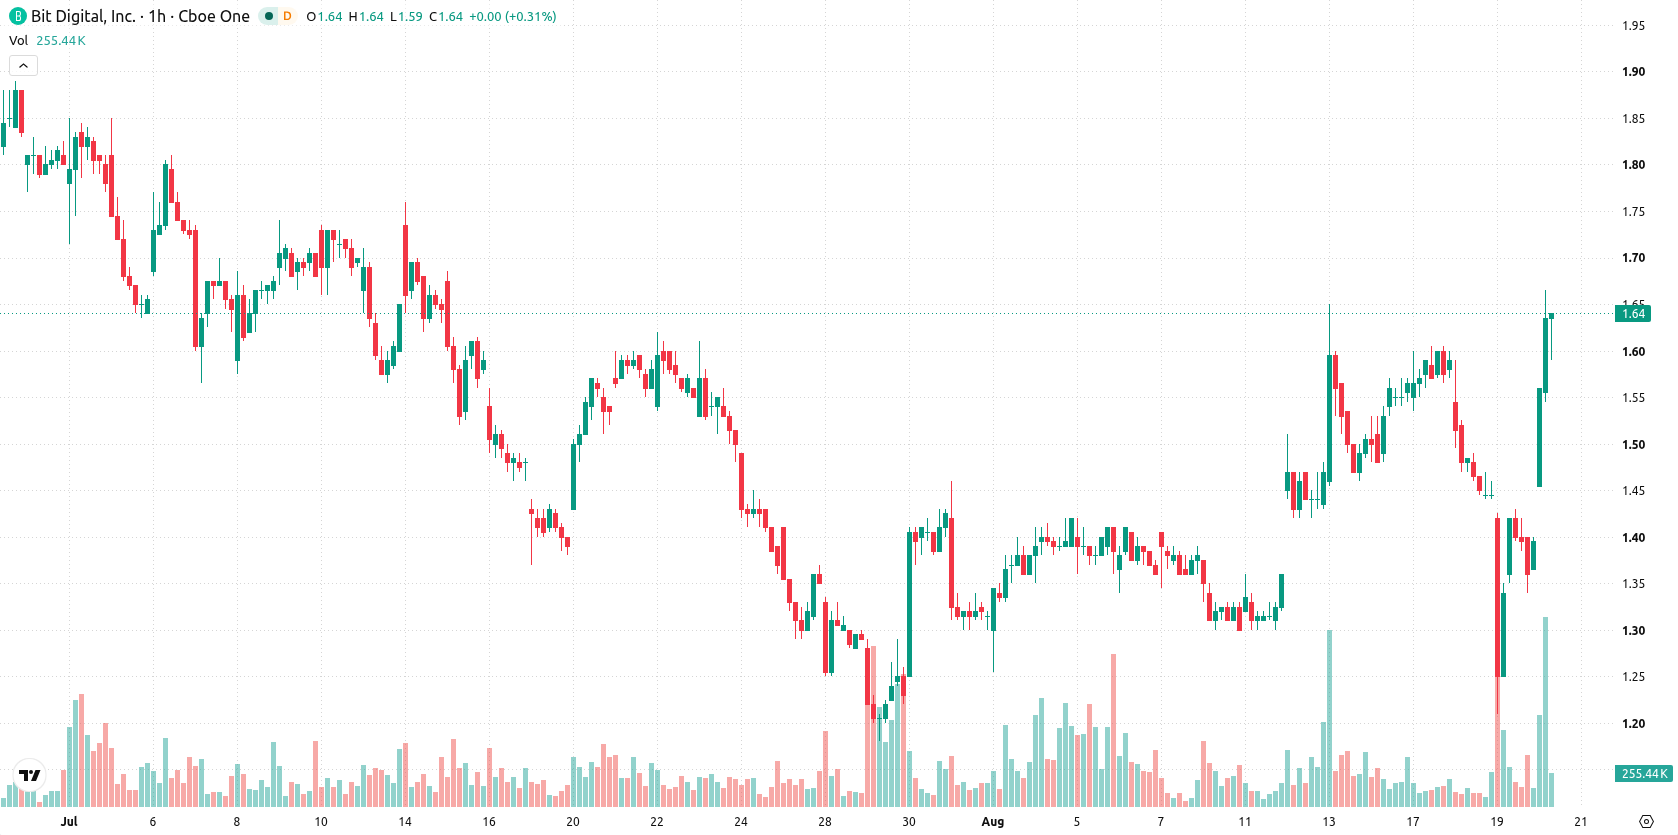
Bit Digital (BTBT) stock is trading at $1.64 today, moving up 16.79% from the previous close. The stock is currently positioned above its key short- and medium-term moving averages, though it remains below the longer-term average.
 0.7593
0.8749
Highlights
- BTBT/USD trades with short- and medium-term bullish momentum but faces longer-term selling pressure as it remains below the 200-day moving average.
- Momentum indicators are overbought and buyers dominate intraday activity, yet some oscillators remain neutral and suggest risk of exhaustion.
- The short-term projected range is $1.47 to $1.81, with immediate support at $1.43 and breakout resistance at $1.81.
Overbought signals intensify as bullish momentum faces exhaustion risk
On the technical side, BTBT remains above the MA-20 and MA-50, but still trades below the MA-200 on the daily chart. The Ichimoku Kijun sits at $1.43 and serves as immediate support. RSI is at 62.99, indicating a Buy signal, while both Stochastic RSI and CCI are overbought. Bull/Bear Power confirms dominant buying momentum intraday, although both MACD and Awesome Oscillator are neutral. ADX shows a Buy signal, pointing to strengthening trend momentum. The mix of overbought oscillator readings with strong buyer presence suggests potential caution for momentum exhaustion.
Bullish bias prevails amid narrow consolidation range
In the short term, BTBT is expected to consolidate between $1.47 and $1.81 over the next two to three sessions, reflecting typical volatility. The likelihood of an upward price move is very high, whereas the probability of a downturn remains low. A sustained break above the $1.81 resistance would establish a bullish scenario, while a drop below immediate support at $1.43 would signal a potential bearish outcome within this timeframe.
Earlier, analysts noted that Bit Digital was under sustained technical pressure, with prevailing indicators pointing to a potential downside and a lack of clear bullish momentum. The current shift above key short- and medium-term moving averages, paired with strong buying signals, marks a notable change in the technical landscape and highlights $1.81 as a critical resistance level to monitor for confirmation of a continued upside move.






Latest Bit Digital News



-
 Afghanistan
-
 Albania
-
 Algeria
-
 Angola
-
 Argentina
-
 Armenia
-
 Australia
-
 Austria
-
 Azerbaijan
-
 Bahamas
-
 Bahrain
-
 Bangladesh
-
 Belarus
-
 Belgium
-
 Bolivia
-
 Botswana
-
 Brazil
-
 Brunei
-
 Bulgaria
-
 Cambodia
-
 Cameroon
-
 Canada
-
 Chile
-
 China
-
 Colombia
-
 Congo
-
 Costa Rica
-
 Cote d'Ivoire
-
 Croatia
-
 Cuba
-
 Cyprus
-
 Czechia
-
 DR Congo
-
 Denmark
-
 Dominican Republic
-
 Ecuador
-
 Egypt
-
 El Salvador
-
 Estonia
-
 Eswatini
-
 Ethiopia
-
 Finland
-
 France
-
 Georgia
-
 Germany
-
 Ghana
-
 Greece
-
 Haiti
-
 Hong Kong
-
 Hungary
-
 India
-
 Indonesia
-
 Iran, Islamic republic
-
 Iraq
-
 Ireland
-
 Israel
-
 Italy
-
 Jamaica
-
 Japan
-
 Jordan
-
 Kazakhstan
-
 Kenya
-
 Korea
-
 Kuwait
-
 Kyrgyzstan
-
 Laos
-
 Latvia
-
 Lebanon
-
 Lesotho
-
 Libya
-
 Lithuania
-
 Luxembourg
-
 Madagascar
-
 Malaysia
-
 Malta
-
 Mauritius
-
 Mexico
-
 Moldova
-
 Mongolia
-
 Montenegro
-
 Morocco
-
 Mozambique
-
 Myanmar
-
 Namibia
-
 Nepal
-
 Netherlands
-
 New Zealand
-
 Nigeria
-
 North Macedonia
-
 Norway
-
 Oman
-
 Pakistan
-
 Palestine
-
 Panama
-
 Papua New Guinea
-
 Paraguay
-
 Peru
-
 Philippines
-
 Poland
-
 Portugal
-
 Puerto Rico
-
 Qatar
-
 Reunion
-
 Romania
-
 Rwanda
-
 Saudi Arabia
-
 Serbia
-
 Singapore
-
 Slovakia
-
 Slovenia
-
 Somalia
-
 South Africa
-
 Spain
-
 Sri Lanka
-
 Sweden
-
 Switzerland
-
 Syria
-
 Taiwan
-
 Tajikistan
-
 Tanzania
-
 Thailand
-
 Trinidad and Tobago
-
 Tunisia
-
 Turkey
-
 UAE
-
 Uganda
-
 Ukraine
-
 United Kingdom
-
United States
-
 Uruguay
-
 Uzbekistan
-
 Venezuela
-
 Vietnam
-
 Yemen
-
 Zambia
-
 Zimbabwe
- Forex
- Crypto












