

GE Aerospace shares technical analysis: Support pressure builds at $336.5

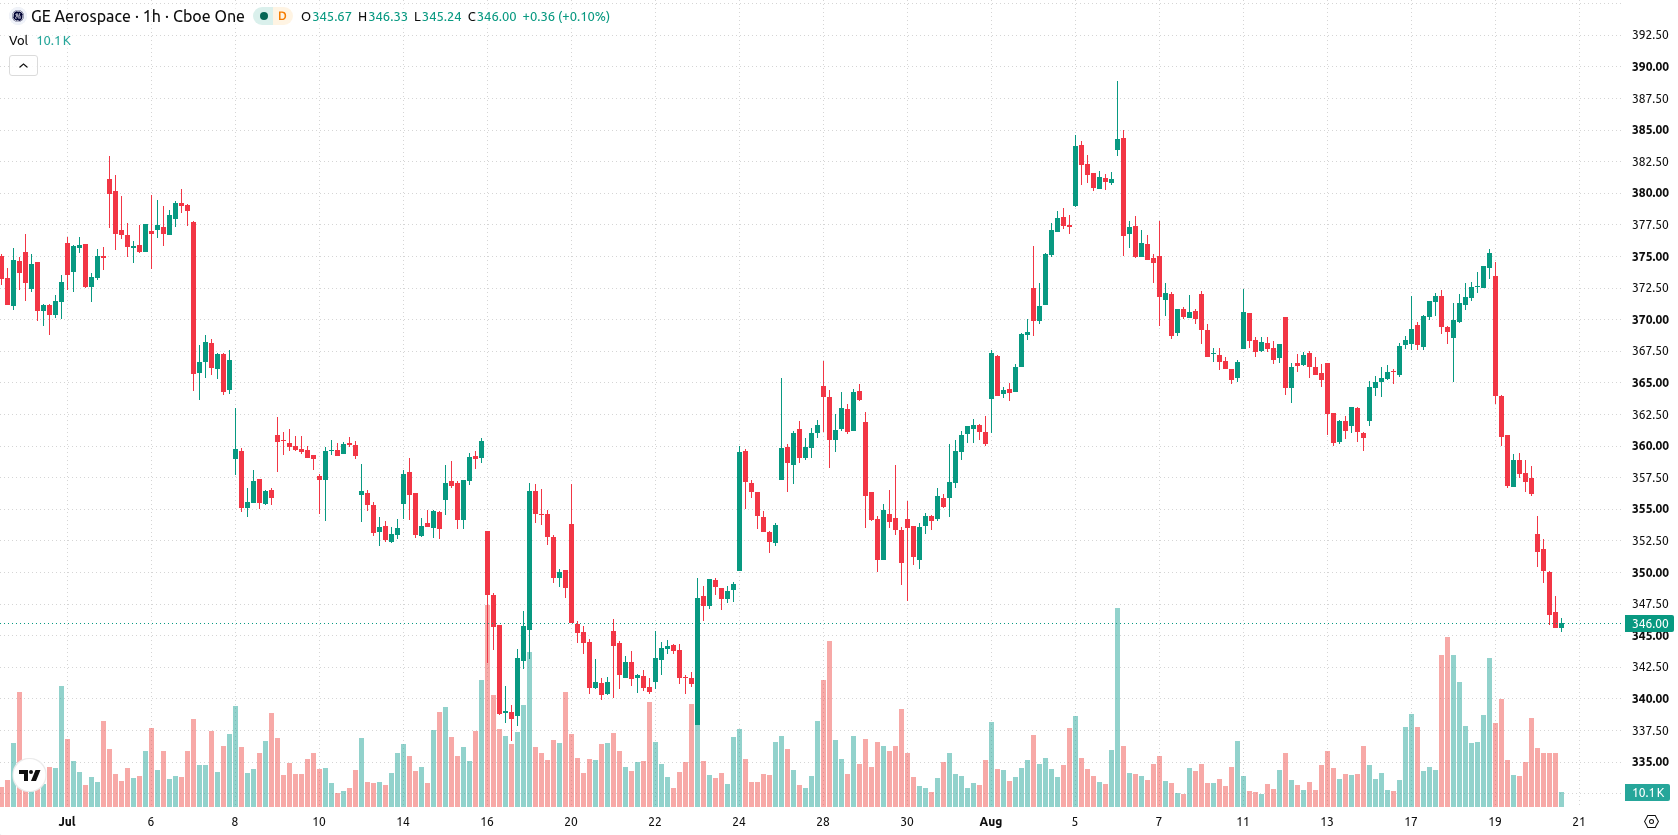
GE Aerospace (GE) stock is trading at $345.15 after a 3.11% drop for the day, closing lower near the session’s lows. The price sits below its key moving averages, which points to continued seller pressure on short- and medium-term timeframes.
 333.33
333.65
Highlights
- GE Aerospace reported annual revenue of $45.85 billion with net profit of $8.70 billion, showing strong past financial performance.
- Valuation concerns and ongoing supply chain constraints raise uncertainty about the sustainment of recent stock gains and future earnings.
- Shares of GE closed at $345.15, falling 3.11% as technical signals turn bearish and forecast a trading range of $336.5 to $353.8.
Valuation limits gains as profit-taking follows strong results
GE Aerospace reported annual revenue of $45.85 billion and a net profit of $8.70 billion as of August 19, reflecting robust past performance but sparking a round of profit-taking by investors following a strong rally. According to the news, valuation concerns have surfaced that may limit further upside in the near term, as participants re-evaluate the sustainability of recent gains. Persistent supply chain constraints continue to affect the company's outlook, introducing fresh uncertainty for future earnings and supporting a cautious stance among market participants.
Broad technical weakness as GE tests oversold momentum thresholds
On the h1 timeframe, GE is trading below the MA-20 at $362.71 and the MA-50 at $364.62, while still holding above the MA-200 at $319.27. The Ichimoku Kijun is positioned at $360.8, establishing immediate resistance. Momentum indicators reinforce broad weakness: MACD and ADX both indicate a sell bias, with RSI at a deeply oversold 24.43. Stoch RSI and CCI are also in oversold territory, and Bull/Bear Power continues to confirm dominance by sellers. The Awesome Oscillator aligns with the prevailing downward trend, collectively highlighting strong short-term downside pressure.
Limited upside reversal as volatility band constrains GE’s short-term outlook
In the short term, GE is expected to trade within a volatility band between $336.5 and $353.8 over the next few sessions. The probability of a reversal to the upside is limited at 28%, while further declines remain more likely with a 72% chance. The baseline scenario anticipates sideways movement within this range; an upside break above $360.8 would open the door to renewed gains, while a drop below $336.5 could trigger a further extension of the decline.
Earlier, analysts noted that GE Aerospace faced valuation concerns and operational headwinds, leaving the stock vulnerable to continued downside pressure. The current analysis reaffirms these challenges with fresh downside momentum and suggests that traders should closely monitor the $336.5 level, as a break below this threshold could accelerate further declines.






Latest General Electric News





-
 Afghanistan
-
 Albania
-
 Algeria
-
 Angola
-
 Argentina
-
 Armenia
-
 Australia
-
 Austria
-
 Azerbaijan
-
 Bahamas
-
 Bahrain
-
 Bangladesh
-
 Belarus
-
 Belgium
-
 Bolivia
-
 Botswana
-
 Brazil
-
 Brunei
-
 Bulgaria
-
 Cambodia
-
 Cameroon
-
 Canada
-
 Chile
-
 China
-
 Colombia
-
 Congo
-
 Costa Rica
-
 Cote d'Ivoire
-
 Croatia
-
 Cuba
-
 Cyprus
-
 Czechia
-
 DR Congo
-
 Denmark
-
 Dominican Republic
-
 Ecuador
-
 Egypt
-
 El Salvador
-
 Estonia
-
 Eswatini
-
 Ethiopia
-
 Finland
-
 France
-
 Georgia
-
 Germany
-
 Ghana
-
 Greece
-
 Haiti
-
 Hong Kong
-
 Hungary
-
 India
-
 Indonesia
-
 Iran, Islamic republic
-
 Iraq
-
 Ireland
-
 Israel
-
 Italy
-
 Jamaica
-
 Japan
-
 Jordan
-
 Kazakhstan
-
 Kenya
-
 Korea
-
 Kuwait
-
 Kyrgyzstan
-
 Laos
-
 Latvia
-
 Lebanon
-
 Lesotho
-
 Libya
-
 Lithuania
-
 Luxembourg
-
 Madagascar
-
 Malaysia
-
 Malta
-
 Mauritius
-
 Mexico
-
 Moldova
-
 Mongolia
-
 Montenegro
-
 Morocco
-
 Mozambique
-
 Myanmar
-
 Namibia
-
 Nepal
-
 Netherlands
-
 New Zealand
-
 Nigeria
-
 North Macedonia
-
 Norway
-
 Oman
-
 Pakistan
-
 Palestine
-
 Panama
-
 Papua New Guinea
-
 Paraguay
-
 Peru
-
 Philippines
-
 Poland
-
 Portugal
-
 Puerto Rico
-
 Qatar
-
 Reunion
-
 Romania
-
 Rwanda
-
 Saudi Arabia
-
 Serbia
-
 Singapore
-
 Slovakia
-
 Slovenia
-
 Somalia
-
 South Africa
-
 Spain
-
 Sri Lanka
-
 Sweden
-
 Switzerland
-
 Syria
-
 Taiwan
-
 Tajikistan
-
 Tanzania
-
 Thailand
-
 Trinidad and Tobago
-
 Tunisia
-
 Turkey
-
 UAE
-
 Uganda
-
 Ukraine
-
 United Kingdom
-
United States
-
 Uruguay
-
 Uzbekistan
-
 Venezuela
-
 Vietnam
-
 Yemen
-
 Zambia
-
 Zimbabwe
- Forex
- Crypto












