

Can Riot Platforms stock hold support as overbought conditions persist?

Riot Platforms (RIOT) stock is trading at $20.26, retreating 3.46% on the day. The price remains situated above its key moving averages, reflecting ongoing positive momentum despite the current correction.
 17.10
17.10
Highlights
- Riot Platforms secured approximately $9.8 billion in long-term contracted revenue with 241MW of AI data center leases to major tech clients.
- The company obtained a $573 million term loan maturing in 2026 to fund equipment for a 191 MW data center expansion at its Rockdale Facility.
- RIOT stock trades with upward momentum and overbought indicators, with a projected 2 to 3 day range of $18.86 to $21.66.
Data center expansion and long-term contracts drive revenue diversification
Riot Platforms has signed large-scale AI data center leases covering 241MW of IT capacity with two major technology customers, securing approximately $9.8 billion in long-term contracted revenue and accelerating its shift from a mining-only model, according to Pulse2. This significant expansion in the data center business broadens Riot's revenue sources and positions the company for secular growth in cloud infrastructure demand. Additionally, Riot recently closed a $573 million delayed-draw term loan maturing in late 2026 to support equipment build-out for a 191 MW data center at its Rockdale Facility. These positive developments introduce long-term business momentum, though price action has remained under broader selling pressure.
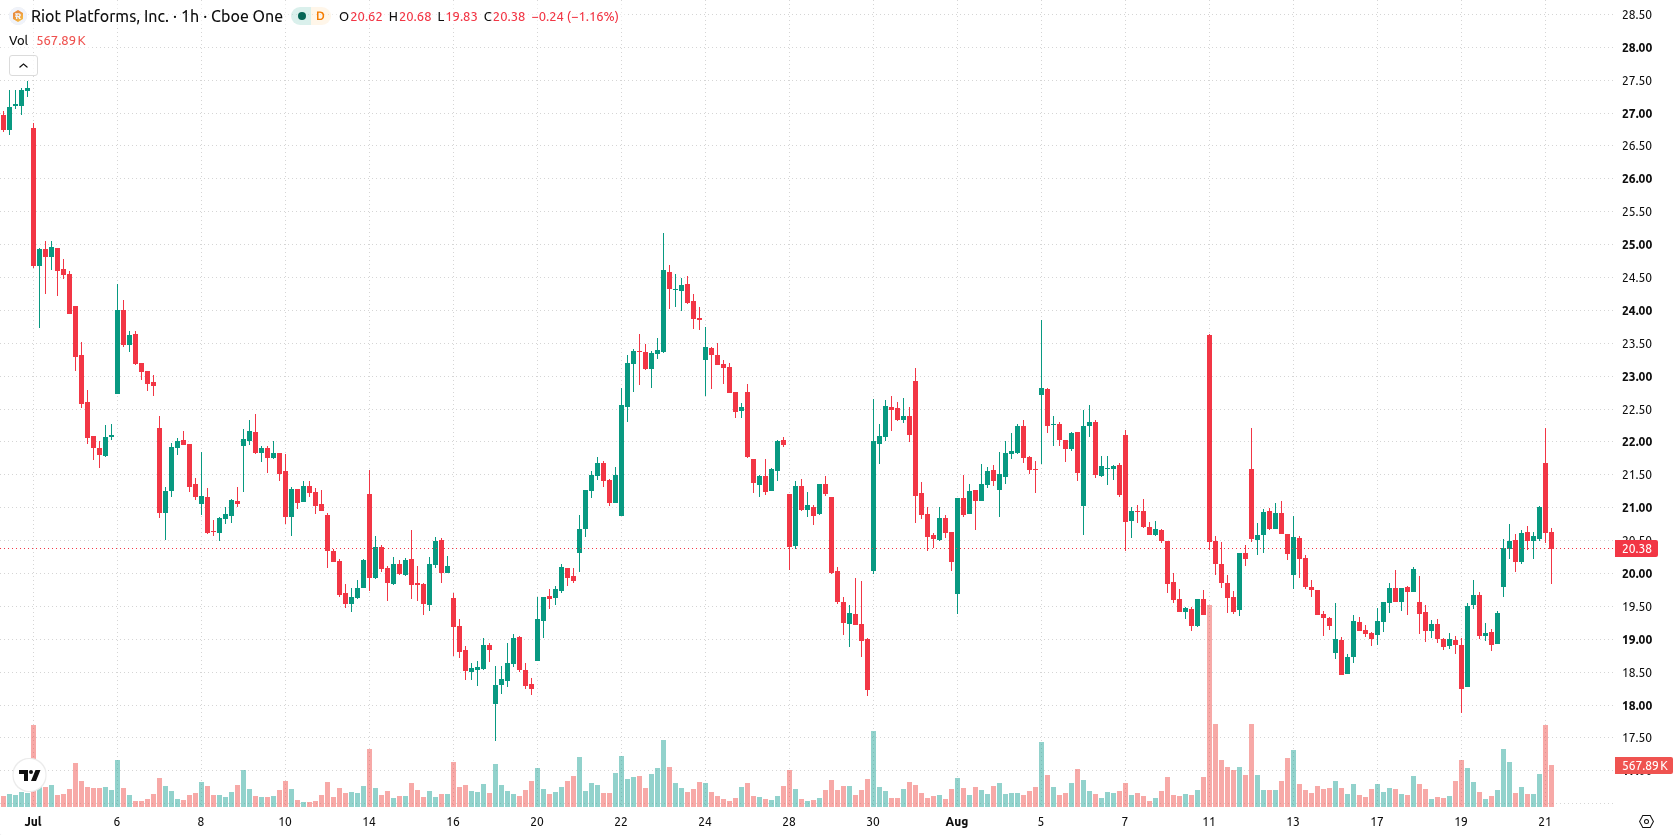
Bullish bias and overbought signals amid strong support levels
On the h1 chart, RIOT is trading above both the MA-20 and MA-50, while on the daily chart it sits well above the MA-200, suggesting near-term and longer-term trend support at these levels. The Ichimoku Kijun at $20.01 represents immediate support for price action. Momentum indicators show MACD flashing a Buy, while ADX remains neutral. RSI stands elevated at 68.28, and both Stoch RSI and CCI reflect overbought conditions, while intraday Bull/Bear Power readings confirm buyer dominance. The Awesome Oscillator also supports the bullish momentum, despite today's price retracement and a negative gap on high volatility.
Range-bound consolidation as breakout risk shapes near-term path
Over the coming 2–3 trading days, RIOT is expected to consolidate within the $18.86 to $21.66 range, which outlines a typical volatility band relative to current levels. The probability of an upside move is assessed at 68%, with a less likely chance for further downside. The base scenario anticipates that price will move sideways in this bandwidth. A breakout above resistance could catalyze further gains, while a drop below immediate support might open a test of the lower end of the current range.
Earlier, analysts noted that Riot Platforms was at a pivotal moment as it shifted from a Bitcoin-mining focus toward large-scale AI data center development. This latest review strengthens that view by highlighting continued momentum in the data center business and indicates that consolidation within the $18.86 to $21.66 range remains the prevailing scenario to monitor in the short term.









-
 Afghanistan
-
 Albania
-
 Algeria
-
 Angola
-
 Argentina
-
 Armenia
-
 Australia
-
 Austria
-
 Azerbaijan
-
 Bahamas
-
 Bahrain
-
 Bangladesh
-
 Belarus
-
 Belgium
-
 Bolivia
-
 Botswana
-
 Brazil
-
 Brunei
-
 Bulgaria
-
 Cambodia
-
 Cameroon
-
 Canada
-
 Chile
-
 China
-
 Colombia
-
 Congo
-
 Costa Rica
-
 Cote d'Ivoire
-
 Croatia
-
 Cuba
-
 Cyprus
-
 Czechia
-
 DR Congo
-
 Denmark
-
 Dominican Republic
-
 Ecuador
-
 Egypt
-
 El Salvador
-
 Estonia
-
 Eswatini
-
 Ethiopia
-
 Finland
-
 France
-
 Georgia
-
 Germany
-
 Ghana
-
 Greece
-
 Haiti
-
 Hong Kong
-
 Hungary
-
 India
-
 Indonesia
-
 Iran, Islamic republic
-
 Iraq
-
 Ireland
-
 Israel
-
 Italy
-
 Jamaica
-
 Japan
-
 Jordan
-
 Kazakhstan
-
 Kenya
-
 Korea
-
 Kuwait
-
 Kyrgyzstan
-
 Laos
-
 Latvia
-
 Lebanon
-
 Lesotho
-
 Libya
-
 Lithuania
-
 Luxembourg
-
 Madagascar
-
 Malaysia
-
 Malta
-
 Mauritius
-
 Mexico
-
 Moldova
-
 Mongolia
-
 Montenegro
-
 Morocco
-
 Mozambique
-
 Myanmar
-
 Namibia
-
 Nepal
-
 Netherlands
-
 New Zealand
-
 Nigeria
-
 North Macedonia
-
 Norway
-
 Oman
-
 Pakistan
-
 Palestine
-
 Panama
-
 Papua New Guinea
-
 Paraguay
-
 Peru
-
 Philippines
-
 Poland
-
 Portugal
-
 Puerto Rico
-
 Qatar
-
 Reunion
-
 Romania
-
 Rwanda
-
 Saudi Arabia
-
 Serbia
-
 Singapore
-
 Slovakia
-
 Slovenia
-
 Somalia
-
 South Africa
-
 Spain
-
 Sri Lanka
-
 Sweden
-
 Switzerland
-
 Syria
-
 Taiwan
-
 Tajikistan
-
 Tanzania
-
 Thailand
-
 Trinidad and Tobago
-
 Tunisia
-
 Turkey
-
 UAE
-
 Uganda
-
 Ukraine
-
 United Kingdom
-
United States
-
 Uruguay
-
 Uzbekistan
-
 Venezuela
-
 Vietnam
-
 Yemen
-
 Zambia
-
 Zimbabwe
- Forex
- Crypto












