

What's behind Canadian Pacific Kansas City's latest 2.1% stock pullback?

Canadian Pacific Kansas City (CP) dropped 2.13% today as strong selling pressure emerged after the open, outpacing the bullish momentum signaled by technical indicators. This intraday weakness contradicts the underlying uptrend, with the stock still trading above key moving averages but failing to hold recent gains.
 135.75
Highlights
- Canadian Pacific Kansas City stock trades above key short-, medium-, and long-term moving averages, signaling a strong uptrend.
- Short-term technical indicators show overbought conditions with elevated RSI and positive momentum despite intraday weakness and a session drop to C$130.25.
- For the next five days, the expected trading range is C$128.27 to C$132.95, with high probability of an upward move unless C$129.36 support breaks.
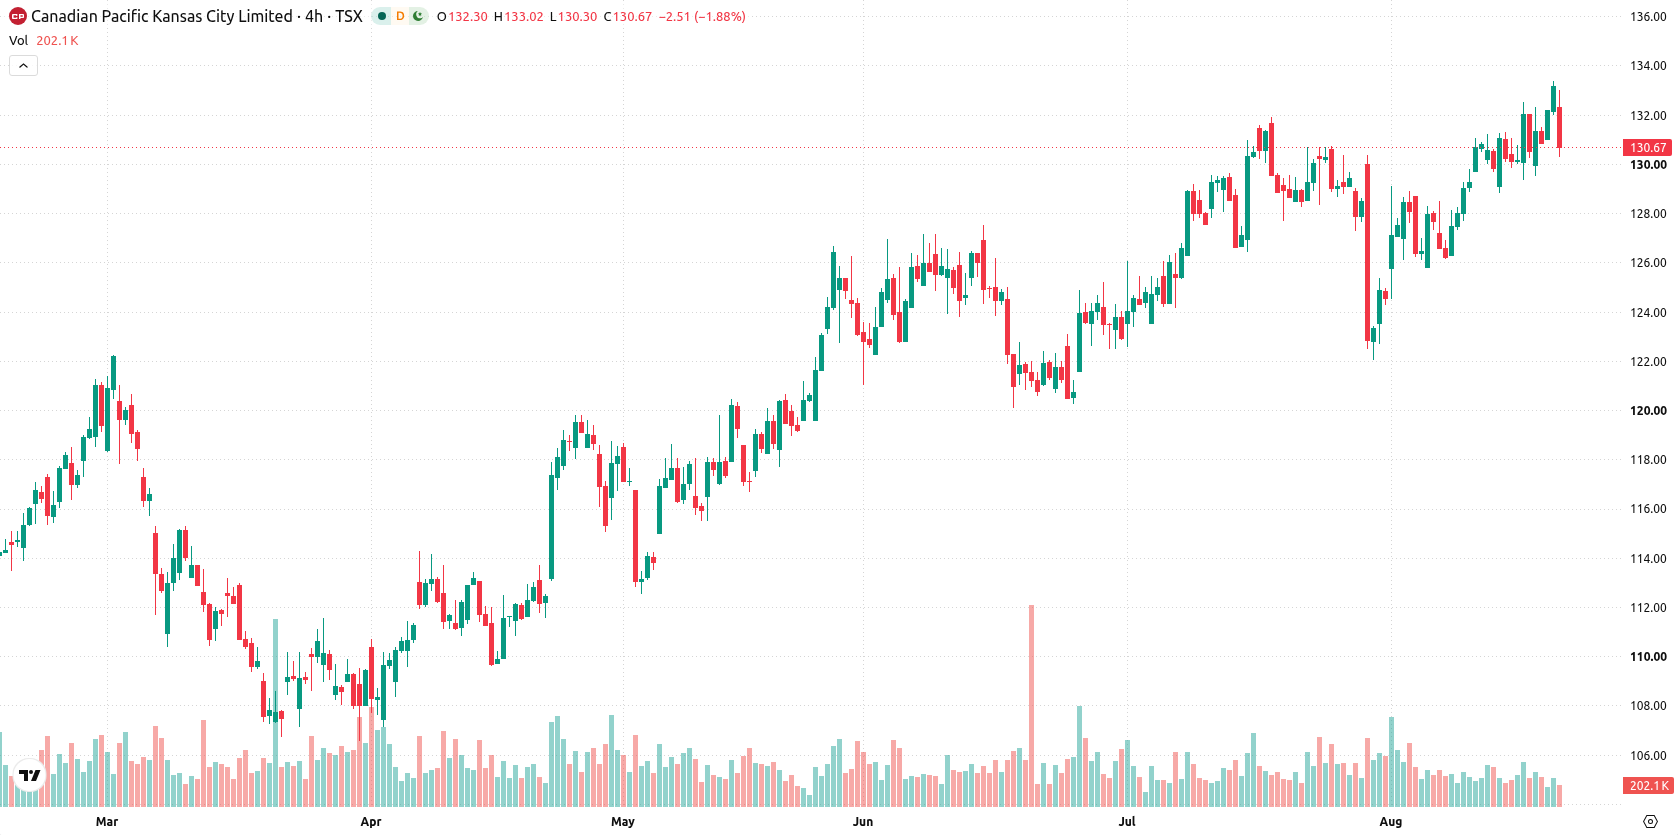
Bullish structure persists despite overbought signals and heightened volatility
CP is trading above its 20-day (C$128.67), 50-day (C$126.81), and 200-day (C$113.7) moving averages, confirming a strong bullish structure across short-, medium-, and long-term timeframes. Key technical levels set immediate support at C$129.36 and resistance at C$130.76. Momentum indicators remain positive, with the MACD showing further buy potential and the Average Directional Index (ADX) indicating a neutral trend. The Relative Strength Index (RSI) is elevated at 64.63, supported by positive Bull/Bear Power (BBP), while the Commodity Channel Index (CCI) and Stochastic RSI highlight overbought conditions. Despite generally favorable momentum, the session saw a 2.13% drop, as volatility picked up to 1.41% and the price fell toward its intraday low, revealing a divergence between bullish signals and guarded price action.
Earlier, analysts noted that Canadian Pacific Kansas City was experiencing consolidation amid substantial institutional inflows, with mixed technical signals guiding its near-term outlook. The current analysis strengthens this view as short-term volatility and conflicting intraday signals underscore the importance of monitoring the C$130.76 resistance for signs of a breakout in the coming sessions.













-
 Afghanistan
-
 Albania
-
 Algeria
-
 Angola
-
 Argentina
-
 Armenia
-
 Australia
-
 Austria
-
 Azerbaijan
-
 Bahamas
-
 Bahrain
-
 Bangladesh
-
 Belarus
-
 Belgium
-
 Bolivia
-
 Botswana
-
 Brazil
-
 Brunei
-
 Bulgaria
-
 Cambodia
-
 Cameroon
-
 Canada
-
 Chile
-
 China
-
 Colombia
-
 Congo
-
 Costa Rica
-
 Cote d'Ivoire
-
 Croatia
-
 Cuba
-
 Cyprus
-
 Czechia
-
 DR Congo
-
 Denmark
-
 Dominican Republic
-
 Ecuador
-
 Egypt
-
 El Salvador
-
 Estonia
-
 Eswatini
-
 Ethiopia
-
 Finland
-
 France
-
 Georgia
-
 Germany
-
 Ghana
-
 Greece
-
 Haiti
-
 Hong Kong
-
 Hungary
-
 India
-
 Indonesia
-
 Iran, Islamic republic
-
 Iraq
-
 Ireland
-
 Israel
-
 Italy
-
 Jamaica
-
 Japan
-
 Jordan
-
 Kazakhstan
-
 Kenya
-
 Korea
-
 Kuwait
-
 Kyrgyzstan
-
 Laos
-
 Latvia
-
 Lebanon
-
 Lesotho
-
 Libya
-
 Lithuania
-
 Luxembourg
-
 Madagascar
-
 Malaysia
-
 Malta
-
 Mauritius
-
 Mexico
-
 Moldova
-
 Mongolia
-
 Montenegro
-
 Morocco
-
 Mozambique
-
 Myanmar
-
 Namibia
-
 Nepal
-
 Netherlands
-
 New Zealand
-
 Nigeria
-
 North Macedonia
-
 Norway
-
 Oman
-
 Pakistan
-
 Palestine
-
 Panama
-
 Papua New Guinea
-
 Paraguay
-
 Peru
-
 Philippines
-
 Poland
-
 Portugal
-
 Puerto Rico
-
 Qatar
-
 Reunion
-
 Romania
-
 Rwanda
-
 Saudi Arabia
-
 Serbia
-
 Singapore
-
 Slovakia
-
 Slovenia
-
 Somalia
-
 South Africa
-
 Spain
-
 Sri Lanka
-
 Sweden
-
 Switzerland
-
 Syria
-
 Taiwan
-
 Tajikistan
-
 Tanzania
-
 Thailand
-
 Trinidad and Tobago
-
 Tunisia
-
 Turkey
-
 UAE
-
 Uganda
-
 Ukraine
-
 United Kingdom
-
United States
-
 Uruguay
-
 Uzbekistan
-
 Venezuela
-
 Vietnam
-
 Yemen
-
 Zambia
-
 Zimbabwe
- Forex
- Crypto












