

GlobalFoundries stock falls nearly 4% as bearish momentum and technical weakness persist

GlobalFoundries Inc (GFS) dropped 3.75% as persistent selling pressure and bearish momentum drove the price below all major moving averages. The sustained downtrend is reinforced by technical weakness, with immediate support and resistance levels defining price action.
 46.46
47.20
Highlights
- Shares of GlobalFoundries fell 3.75% to $46.25, trading below major moving averages and confirming strong selling pressure.
- Momentum and volatility indicators support a negative outlook, with multiple signals pointing to oversold conditions and seller dominance.
- The price is expected to consolidate between $43.93 and $48.57, with over 80% probability of further downside unless resistance at $46.96 is broken.
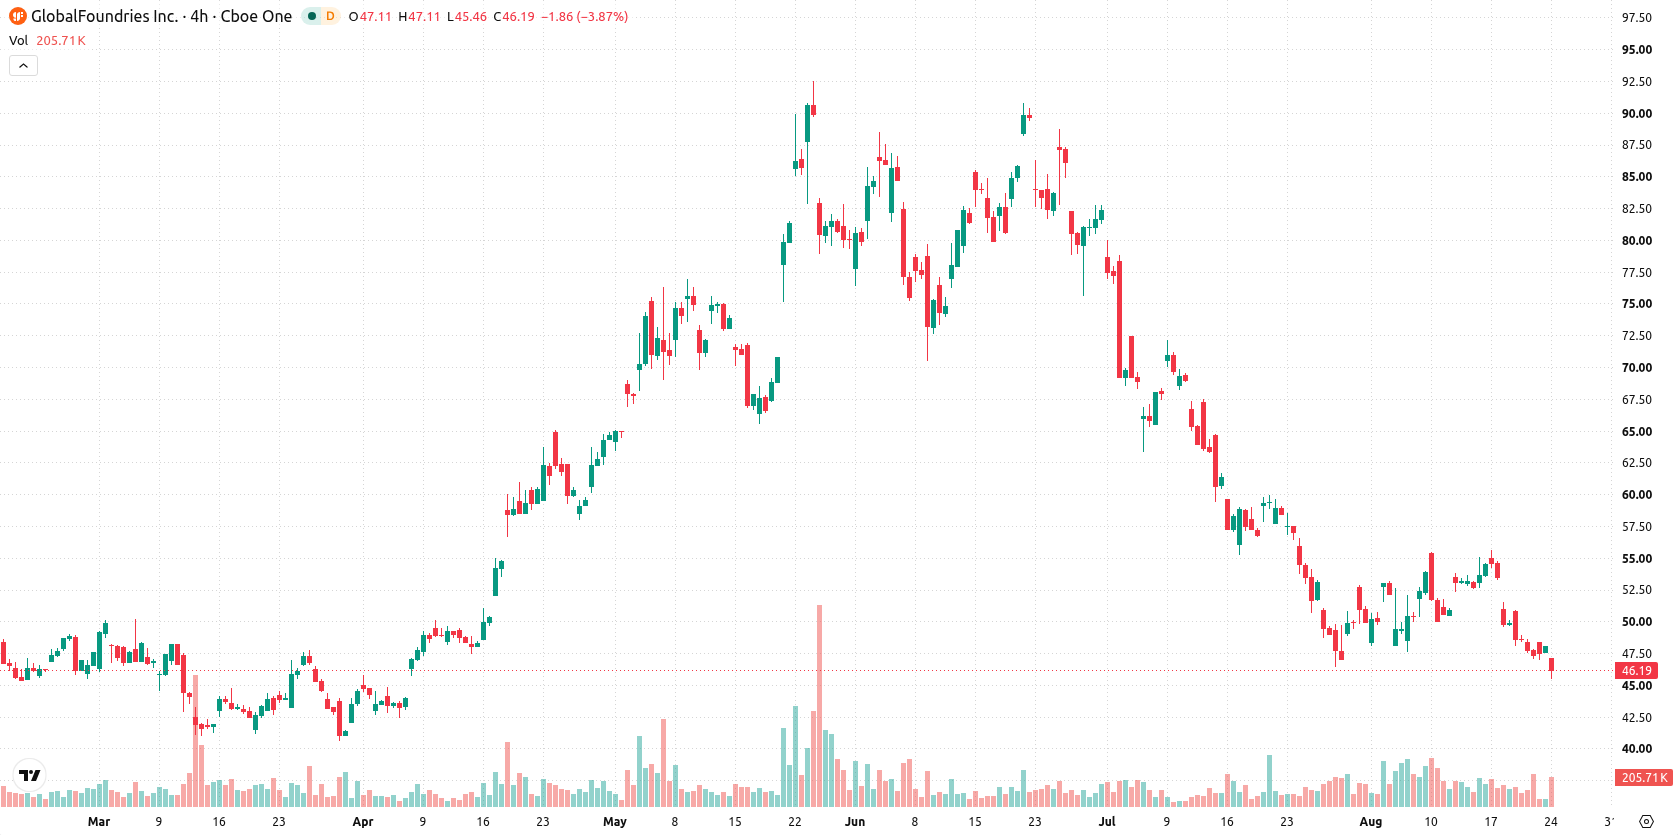
Bearish momentum deepens as indicators and levels confirm pressure
GlobalFoundries is currently trading below all major moving averages, with the price under the MA-20 ($50.68), MA-50 ($63.40), and MA-200 ($52.74), signaling persistent selling pressure across short-, medium-, and long-term horizons. The Ichimoku Kijun ($53.15) sits far above as additional trend confirmation, while near-term support is at $45.58 and immediate resistance is at $46.96. Momentum readings reveal strong negative bias: the MACD stands at -3.9 (Strong Sell) and the Average Directional Index (ADX) is at 26.58 (Sell), suggesting a strengthening bearish trend. The Relative Strength Index (RSI) at 37.41 indicates selling momentum, confirmed by the Commodity Channel Index (CCI) at -122.13 (Oversold) and Bull/Bear Power (BBP) at -2.43 (Oversold), reflecting clear seller dominance. The Awesome Oscillator also aligns with the current downward move. The stock is trading at $46.25 after a downside gap of approximately $0.94 (1.96%), slipping 3.75% on the day and sitting mid-range with intraday volatility at 3.36%. This combination signals sustained pressure after the open and confirms the momentum indicators' negative outlook.
Earlier, analysts noted that GlobalFoundries shares remained under technical pressure as sellers dominated the short- and medium-term trend despite some indications of long-term support. The current analysis confirms and intensifies this bearish outlook, with sustained negative momentum now placing particular emphasis on $45.58 as the critical downside level to monitor for further risk.






Latest GlobalFoundries Inc News




-
 Afghanistan
-
 Albania
-
 Algeria
-
 Angola
-
 Argentina
-
 Armenia
-
 Australia
-
 Austria
-
 Azerbaijan
-
 Bahamas
-
 Bahrain
-
 Bangladesh
-
 Belarus
-
 Belgium
-
 Bolivia
-
 Botswana
-
 Brazil
-
 Brunei
-
 Bulgaria
-
 Cambodia
-
 Cameroon
-
 Canada
-
 Chile
-
 China
-
 Colombia
-
 Congo
-
 Costa Rica
-
 Cote d'Ivoire
-
 Croatia
-
 Cuba
-
 Cyprus
-
 Czechia
-
 DR Congo
-
 Denmark
-
 Dominican Republic
-
 Ecuador
-
 Egypt
-
 El Salvador
-
 Estonia
-
 Eswatini
-
 Ethiopia
-
 Finland
-
 France
-
 Georgia
-
 Germany
-
 Ghana
-
 Greece
-
 Haiti
-
 Hong Kong
-
 Hungary
-
 India
-
 Indonesia
-
 Iran, Islamic republic
-
 Iraq
-
 Ireland
-
 Israel
-
 Italy
-
 Jamaica
-
 Japan
-
 Jordan
-
 Kazakhstan
-
 Kenya
-
 Korea
-
 Kuwait
-
 Kyrgyzstan
-
 Laos
-
 Latvia
-
 Lebanon
-
 Lesotho
-
 Libya
-
 Lithuania
-
 Luxembourg
-
 Madagascar
-
 Malaysia
-
 Malta
-
 Mauritius
-
 Mexico
-
 Moldova
-
 Mongolia
-
 Montenegro
-
 Morocco
-
 Mozambique
-
 Myanmar
-
 Namibia
-
 Nepal
-
 Netherlands
-
 New Zealand
-
 Nigeria
-
 North Macedonia
-
 Norway
-
 Oman
-
 Pakistan
-
 Palestine
-
 Panama
-
 Papua New Guinea
-
 Paraguay
-
 Peru
-
 Philippines
-
 Poland
-
 Portugal
-
 Puerto Rico
-
 Qatar
-
 Reunion
-
 Romania
-
 Rwanda
-
 Saudi Arabia
-
 Serbia
-
 Singapore
-
 Slovakia
-
 Slovenia
-
 Somalia
-
 South Africa
-
 Spain
-
 Sri Lanka
-
 Sweden
-
 Switzerland
-
 Syria
-
 Taiwan
-
 Tajikistan
-
 Tanzania
-
 Thailand
-
 Trinidad and Tobago
-
 Tunisia
-
 Turkey
-
 UAE
-
 Uganda
-
 Ukraine
-
 United Kingdom
-
United States
-
 Uruguay
-
 Uzbekistan
-
 Venezuela
-
 Vietnam
-
 Yemen
-
 Zambia
-
 Zimbabwe
- Forex
- Crypto












