

Axon shares technical analysis: Support pressure builds at $567.45

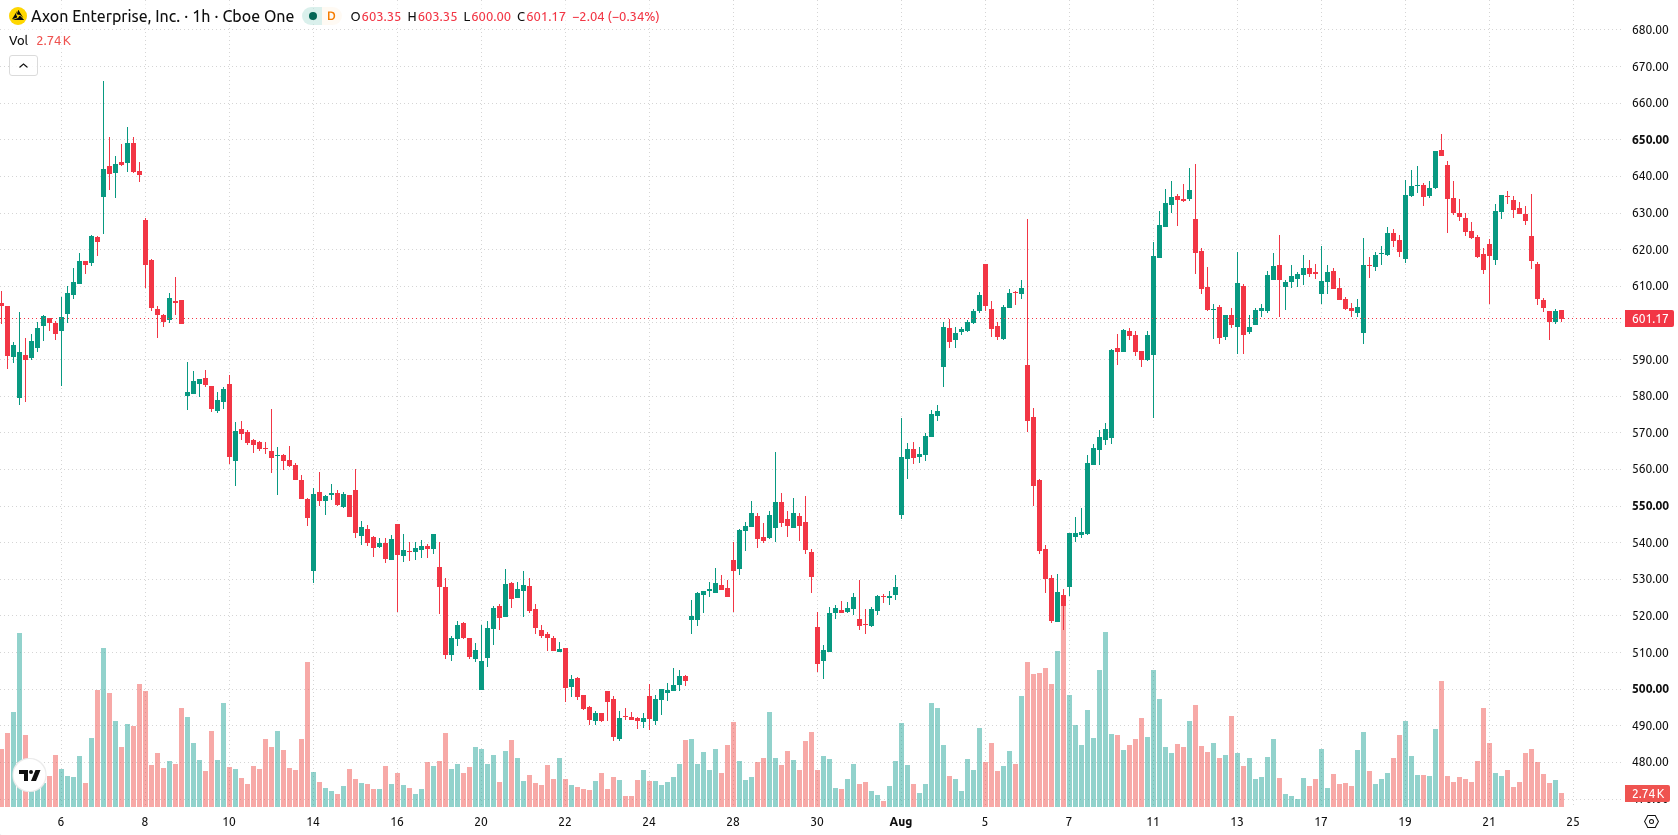
Axon (AXON) stock is trading at $600.47 after a 4.35% decline for the session. The share price sits below its key moving averages, showing short-term selling pressure.
 337.00
439.60
Highlights
- Osmosis Investment Management UK Ltd acquired 12,950 shares of Axon Enterprise valued at approximately $7.26 million in the second quarter.
- The fresh institutional demand may increase Axon Enterprise stock's presence in actively managed portfolios and add market liquidity.
- Shares of Axon Enterprise have faced strong selling pressure, confirmed by bearish momentum and a 71% chance of continued decline to $567.45 to $626.23 over the next 2 to 3 trading days.
Institutional buying drives demand but fails to offset broader selling
Osmosis Investment Management UK Ltd purchased 12,950 shares of Axon Enterprise, Inc, valued at approximately $7.26 million during the second quarter, according to MarketBeat. This institutional acquisition added fresh demand for AXON shares, expanding the company's presence in actively managed portfolios and potentially contributing to deeper market liquidity. However, price action has remained under broader selling pressure.
Bearish momentum dominates as oversold signals clash with resistance
On the technical side, AXON is trading below both the MA-20 at $620.64 and MA-50 at $619.84 on the hourly chart, with price positioned above the MA-200 at $506.76 on the daily chart. The Ichimoku Kijun is noted at $623.31, now acting as immediate resistance. Momentum signals remain negative: RSI is at 34.93, MACD is generating a sell signal, and ADX is neutral. Both Stoch RSI and CCI readings indicate oversold conditions, suggesting a possibility for a short-lived relief bounce. Bull/Bear Power highlights selling dominance through the session, and AO aligns with the overall bearish intraday trend.
Downside risk elevated as price nears volatility band boundaries
Over the short term, price is likely to fluctuate within the $567.45 to $626.23 range, defining the typical volatility band relative to current levels. There is a higher probability (71%) of further downside movement, while a bounce is less likely at 29%. Should AXON break above resistance at $623.31, a move toward the upper end of the range could develop; in contrast, a breach beneath support may accelerate losses to the lower boundary, with consolidation expected if prices hold inside the band.
In a recent review, Axon was highlighted for its strong momentum following municipal contract wins, alongside a positive technical setup above key moving averages. The current decline below those moving averages and prevailing bearish momentum signals a shift in near-term risk, with traders advised to monitor the $567.45–$626.23 volatility band for potential downside extension or short-term reversal attempts.






Latest Axon Enterprise Inc News




-
 Afghanistan
-
 Albania
-
 Algeria
-
 Angola
-
 Argentina
-
 Armenia
-
 Australia
-
 Austria
-
 Azerbaijan
-
 Bahamas
-
 Bahrain
-
 Bangladesh
-
 Belarus
-
 Belgium
-
 Bolivia
-
 Botswana
-
 Brazil
-
 Brunei
-
 Bulgaria
-
 Cambodia
-
 Cameroon
-
 Canada
-
 Chile
-
 China
-
 Colombia
-
 Congo
-
 Costa Rica
-
 Cote d'Ivoire
-
 Croatia
-
 Cuba
-
 Cyprus
-
 Czechia
-
 DR Congo
-
 Denmark
-
 Dominican Republic
-
 Ecuador
-
 Egypt
-
 El Salvador
-
 Estonia
-
 Eswatini
-
 Ethiopia
-
 Finland
-
 France
-
 Georgia
-
 Germany
-
 Ghana
-
 Greece
-
 Haiti
-
 Hong Kong
-
 Hungary
-
 India
-
 Indonesia
-
 Iran, Islamic republic
-
 Iraq
-
 Ireland
-
 Israel
-
 Italy
-
 Jamaica
-
 Japan
-
 Jordan
-
 Kazakhstan
-
 Kenya
-
 Korea
-
 Kuwait
-
 Kyrgyzstan
-
 Laos
-
 Latvia
-
 Lebanon
-
 Lesotho
-
 Libya
-
 Lithuania
-
 Luxembourg
-
 Madagascar
-
 Malaysia
-
 Malta
-
 Mauritius
-
 Mexico
-
 Moldova
-
 Mongolia
-
 Montenegro
-
 Morocco
-
 Mozambique
-
 Myanmar
-
 Namibia
-
 Nepal
-
 Netherlands
-
 New Zealand
-
 Nigeria
-
 North Macedonia
-
 Norway
-
 Oman
-
 Pakistan
-
 Palestine
-
 Panama
-
 Papua New Guinea
-
 Paraguay
-
 Peru
-
 Philippines
-
 Poland
-
 Portugal
-
 Puerto Rico
-
 Qatar
-
 Reunion
-
 Romania
-
 Rwanda
-
 Saudi Arabia
-
 Serbia
-
 Singapore
-
 Slovakia
-
 Slovenia
-
 Somalia
-
 South Africa
-
 Spain
-
 Sri Lanka
-
 Sweden
-
 Switzerland
-
 Syria
-
 Taiwan
-
 Tajikistan
-
 Tanzania
-
 Thailand
-
 Trinidad and Tobago
-
 Tunisia
-
 Turkey
-
 UAE
-
 Uganda
-
 Ukraine
-
 United Kingdom
-
United States
-
 Uruguay
-
 Uzbekistan
-
 Venezuela
-
 Vietnam
-
 Yemen
-
 Zambia
-
 Zimbabwe
- Forex
- Crypto












