


Bit Digital Inc (BTBT) advanced 3.31% as technical momentum drove buying interest after an upside gap at the open. The recovery looks limited, given the price remains below its 50-day and 200-day moving averages, signaling persistent medium- and long-term resistance.
 0.7549
0.8749
Highlights
- Shares of Bit Digital trade above the 20-day average but remain under key medium- and long-term moving averages, indicating short-term momentum but persistent broader selling pressure.
- Momentum indicators such as the Relative Strength Index and Commodity Channel Index skew toward buying, but MACD and ADX suggest a lack of clear directional conviction.
- For the next five trading days, anticipated range is $1.3 to $1.82 with a 53% probability of a downward move and main support at $1.51.
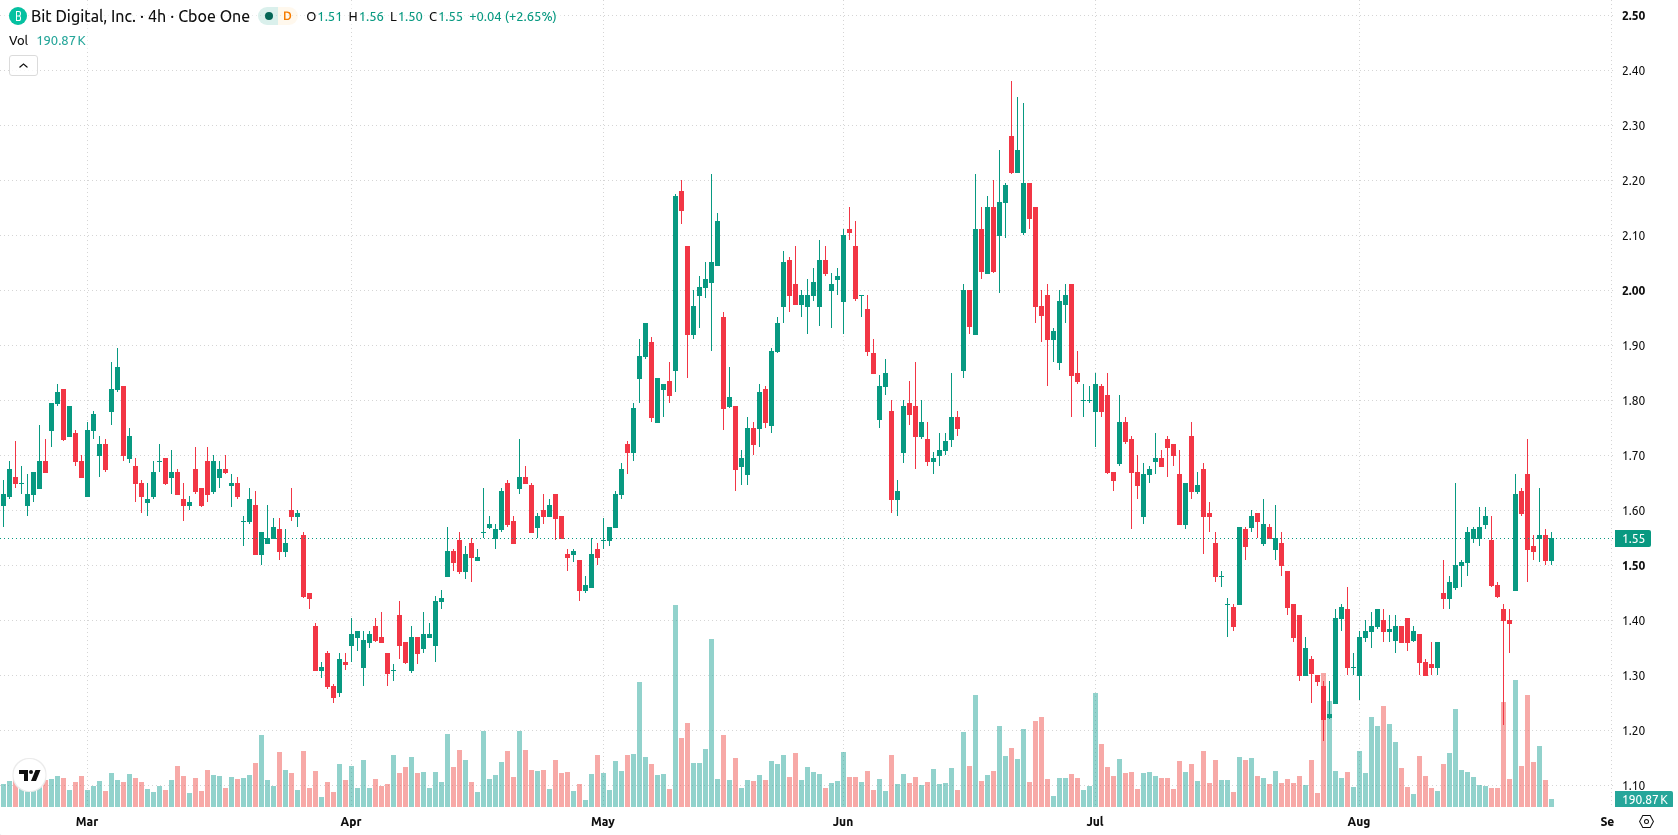
Near-term support holds as long-term bearish signals persist
Bit Digital is trading above its 20-day moving average at $1.42, but remains below both its 50-day ($1.61) and 200-day ($1.85) moving averages. This positioning suggests near-term strength, yet the broader structure reflects sustained pressure from sellers. The Ichimoku Kijun at $1.45 offers underlying support. The prevailing MA-50 versus MA-200 alignment is bearish, with a near-term floor at $1.51 and resistance at $1.61, marking a tight range for now. The RSI is steady at 50.77, indicating balanced conditions, while the CCI at 93.08 suggests emerging bullishness. Momentum signals from MACD, ADX, and Stochastic RSI remain neutral. Bull/Bear Power at 0.15 and the Awesome Oscillator point to intraday buying strength, though some oscillators diverge from momentum indicators. Daily volatility is 8.61%, and the share is currently mid-range after the early gains.
Earlier, analysts noted that Bit Digital was demonstrating short-term technical strength even as longer-term resistance persisted. This latest analysis reinforces that view, with attention now shifting to whether price action can break above $1.61 resistance in the coming sessions to signal the start of a new bullish phase.






Latest Bit Digital News



-
 Afghanistan
-
 Albania
-
 Algeria
-
 Angola
-
 Argentina
-
 Armenia
-
 Australia
-
 Austria
-
 Azerbaijan
-
 Bahamas
-
 Bahrain
-
 Bangladesh
-
 Belarus
-
 Belgium
-
 Bolivia
-
 Botswana
-
 Brazil
-
 Brunei
-
 Bulgaria
-
 Cambodia
-
 Cameroon
-
 Canada
-
 Chile
-
 China
-
 Colombia
-
 Congo
-
 Costa Rica
-
 Cote d'Ivoire
-
 Croatia
-
 Cuba
-
 Cyprus
-
 Czechia
-
 DR Congo
-
 Denmark
-
 Dominican Republic
-
 Ecuador
-
 Egypt
-
 El Salvador
-
 Estonia
-
 Eswatini
-
 Ethiopia
-
 Finland
-
 France
-
 Georgia
-
 Germany
-
 Ghana
-
 Greece
-
 Haiti
-
 Hong Kong
-
 Hungary
-
 India
-
 Indonesia
-
 Iran, Islamic republic
-
 Iraq
-
 Ireland
-
 Israel
-
 Italy
-
 Jamaica
-
 Japan
-
 Jordan
-
 Kazakhstan
-
 Kenya
-
 Korea
-
 Kuwait
-
 Kyrgyzstan
-
 Laos
-
 Latvia
-
 Lebanon
-
 Lesotho
-
 Libya
-
 Lithuania
-
 Luxembourg
-
 Madagascar
-
 Malaysia
-
 Malta
-
 Mauritius
-
 Mexico
-
 Moldova
-
 Mongolia
-
 Montenegro
-
 Morocco
-
 Mozambique
-
 Myanmar
-
 Namibia
-
 Nepal
-
 Netherlands
-
 New Zealand
-
 Nigeria
-
 North Macedonia
-
 Norway
-
 Oman
-
 Pakistan
-
 Palestine
-
 Panama
-
 Papua New Guinea
-
 Paraguay
-
 Peru
-
 Philippines
-
 Poland
-
 Portugal
-
 Puerto Rico
-
 Qatar
-
 Reunion
-
 Romania
-
 Rwanda
-
 Saudi Arabia
-
 Serbia
-
 Singapore
-
 Slovakia
-
 Slovenia
-
 Somalia
-
 South Africa
-
 Spain
-
 Sri Lanka
-
 Sweden
-
 Switzerland
-
 Syria
-
 Taiwan
-
 Tajikistan
-
 Tanzania
-
 Thailand
-
 Trinidad and Tobago
-
 Tunisia
-
 Turkey
-
 UAE
-
 Uganda
-
 Ukraine
-
 United Kingdom
-
United States
-
 Uruguay
-
 Uzbekistan
-
 Venezuela
-
 Vietnam
-
 Yemen
-
 Zambia
-
 Zimbabwe
- Forex
- Crypto












