

Breakout attempt at resistance: Can SOFI extend gains above $19.41?

SoFi Technologies, Inc. (SOFI) stock is trading at $18.77, up 2.91% on the day and closing near its intraday highs. The price sits above its short- and medium-term moving averages, while remaining below higher-term benchmarks.
 17.60
17.63
Highlights
- Kelli Keough, a SoFi Technologies executive, sold 11,286 shares at $18.00 each, totaling $203,148 in insider sales.
- The transaction drew scrutiny over management outlook but did not trigger significant selling pressure as demand for shares stayed high.
- SoFi Technologies stock trades above short- and medium-term technical supports but remains under long-term resistance, with an expected near-term range of $17.81 to $19.41.
Management share sale absorbed as market demand stays firm
Insider activity is drawing attention as Kelli Keough, Executive Vice President at SoFi Technologies, sold 11,286 shares at an average price of $18.00 on August 20, for a total value of $203,148, according to MarketBeat. Insider transactions of this kind often prompt scrutiny over management's outlook and may lead to shifts in near-term trading sentiment, particularly when sales occur close to key price levels. Despite the potential signaling effect, current market conditions appear to have absorbed this development without notable selling pressure, as broader participation keeps the demand for shares elevated.
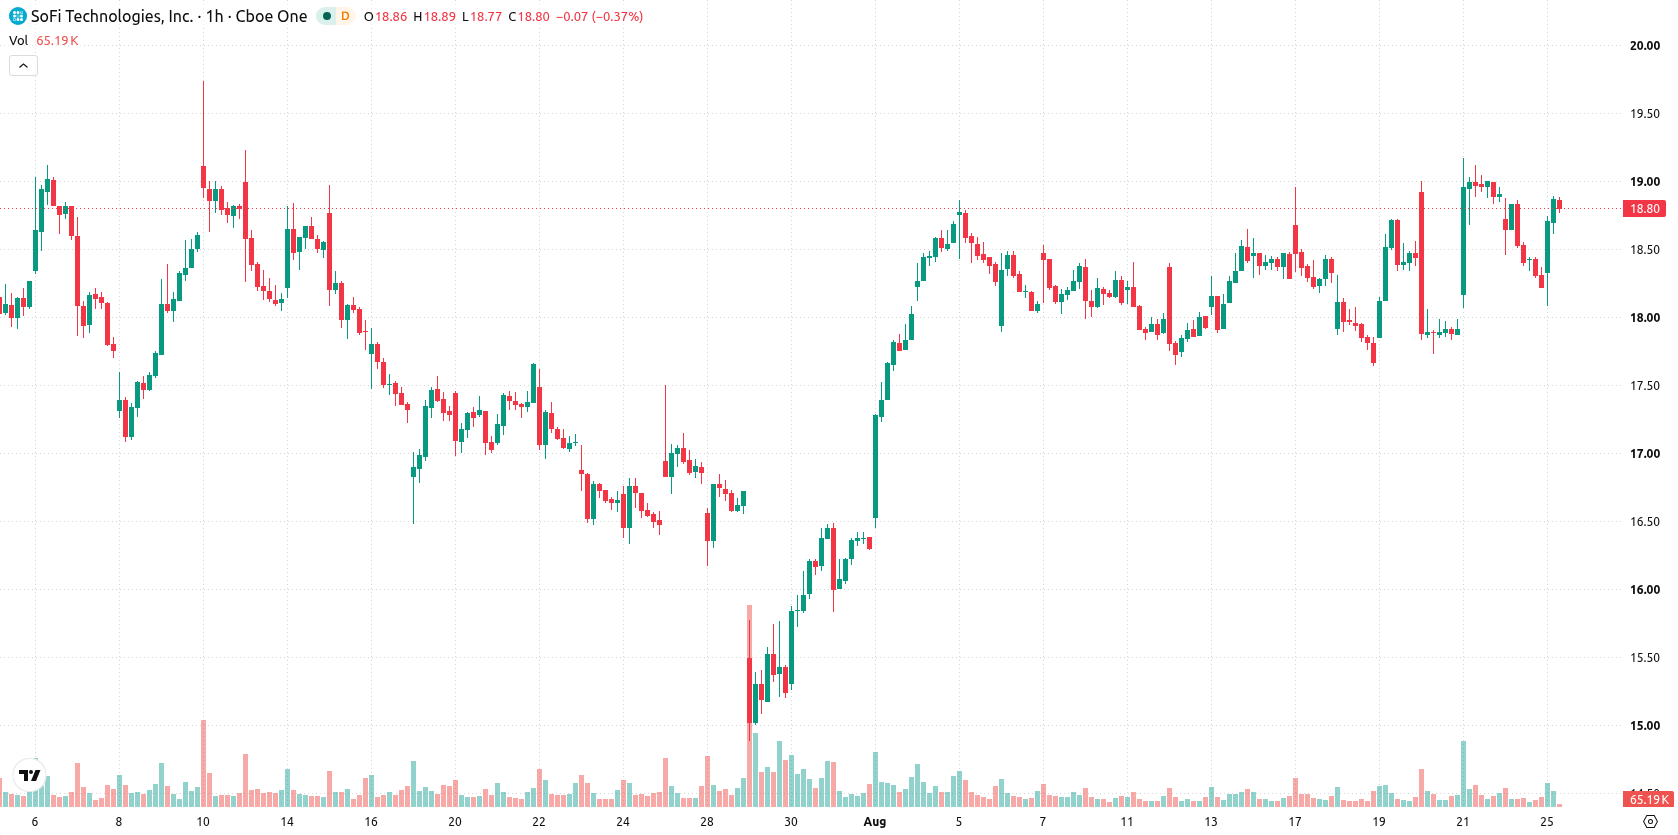
Medium-term buying strength stalls below key long-term resistance
Technically, SOFI crossed above its MA-20 at $18.47 and MA-50 at $18.35 while remaining below the MA-200 at $20.46, highlighting an ongoing divergence between medium- and long-term trends. The Ichimoku Kijun level at $18.45 establishes immediate support. Momentum indicators offer a mixed picture: MACD signals strong buy, while ADX is neutral, pointing to unclear trend strength. RSI is at 43.24 and Stoch RSI is showing signs of waning oversold pressure, with CCI and the Awesome Oscillator both neutral. Bull/Bear Power indicates sellers maintain short-term dominance in intraday trade.
Sideways trading projected as mixed signals temper breakout prospects
In the short term, SOFI is likely to trade in the $17.81 to $19.41 range, with a very high probability for an upward move and significantly less chance for a downward move. The baseline scenario anticipates continued sideways movement within this corridor, as mixed momentum signals balance out directional conviction. A bullish breakout requires a clean move above $19.41, while a reversal is likely only if support near $17.81 gives way.
Earlier, analysts noted that despite positive business momentum at SoFi ongoing technical caution and directional uncertainty persisted. The current analysis adds a new dimension by highlighting elevated insider activity and an improved technical posture, positioning $19.41 as a critical level to watch for any impending breakout.










-
 Afghanistan
-
 Albania
-
 Algeria
-
 Angola
-
 Argentina
-
 Armenia
-
 Australia
-
 Austria
-
 Azerbaijan
-
 Bahamas
-
 Bahrain
-
 Bangladesh
-
 Belarus
-
 Belgium
-
 Bolivia
-
 Botswana
-
 Brazil
-
 Brunei
-
 Bulgaria
-
 Cambodia
-
 Cameroon
-
 Canada
-
 Chile
-
 China
-
 Colombia
-
 Congo
-
 Costa Rica
-
 Cote d'Ivoire
-
 Croatia
-
 Cuba
-
 Cyprus
-
 Czechia
-
 DR Congo
-
 Denmark
-
 Dominican Republic
-
 Ecuador
-
 Egypt
-
 El Salvador
-
 Estonia
-
 Eswatini
-
 Ethiopia
-
 Finland
-
 France
-
 Georgia
-
 Germany
-
 Ghana
-
 Greece
-
 Haiti
-
 Hong Kong
-
 Hungary
-
 India
-
 Indonesia
-
 Iran, Islamic republic
-
 Iraq
-
 Ireland
-
 Israel
-
 Italy
-
 Jamaica
-
 Japan
-
 Jordan
-
 Kazakhstan
-
 Kenya
-
 Korea
-
 Kuwait
-
 Kyrgyzstan
-
 Laos
-
 Latvia
-
 Lebanon
-
 Lesotho
-
 Libya
-
 Lithuania
-
 Luxembourg
-
 Madagascar
-
 Malaysia
-
 Malta
-
 Mauritius
-
 Mexico
-
 Moldova
-
 Mongolia
-
 Montenegro
-
 Morocco
-
 Mozambique
-
 Myanmar
-
 Namibia
-
 Nepal
-
 Netherlands
-
 New Zealand
-
 Nigeria
-
 North Macedonia
-
 Norway
-
 Oman
-
 Pakistan
-
 Palestine
-
 Panama
-
 Papua New Guinea
-
 Paraguay
-
 Peru
-
 Philippines
-
 Poland
-
 Portugal
-
 Puerto Rico
-
 Qatar
-
 Reunion
-
 Romania
-
 Rwanda
-
 Saudi Arabia
-
 Serbia
-
 Singapore
-
 Slovakia
-
 Slovenia
-
 Somalia
-
 South Africa
-
 Spain
-
 Sri Lanka
-
 Sweden
-
 Switzerland
-
 Syria
-
 Taiwan
-
 Tajikistan
-
 Tanzania
-
 Thailand
-
 Trinidad and Tobago
-
 Tunisia
-
 Turkey
-
 UAE
-
 Uganda
-
 Ukraine
-
 United Kingdom
-
United States
-
 Uruguay
-
 Uzbekistan
-
 Venezuela
-
 Vietnam
-
 Yemen
-
 Zambia
-
 Zimbabwe
- Forex
- Crypto












