

Will SoFi stock hold $17.64 support as oversold conditions limit further selling?

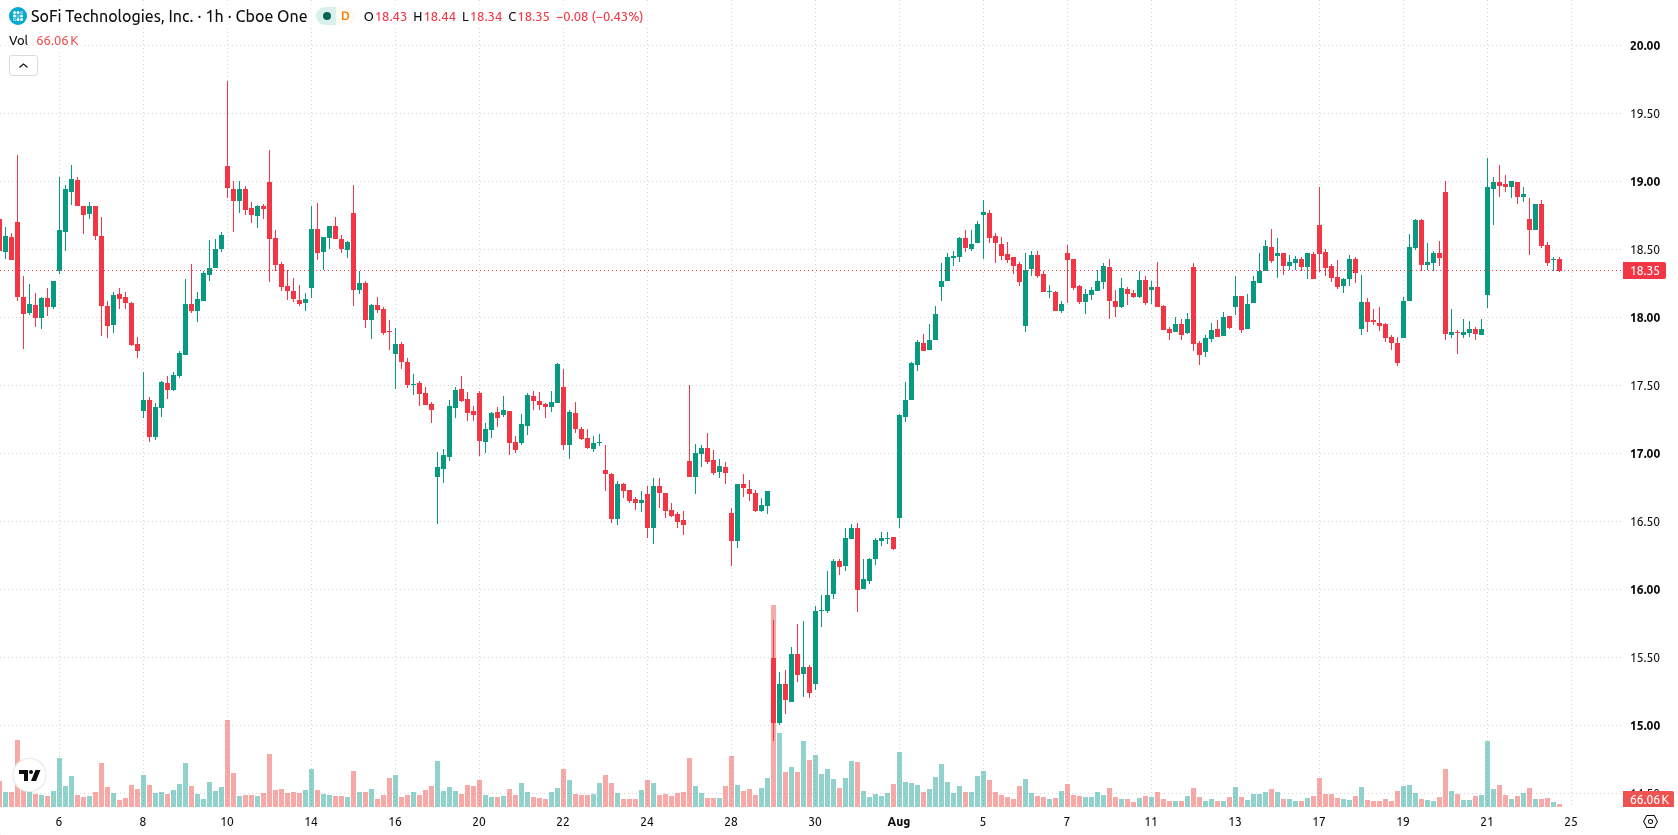
SoFi (SOFI) stock is trading at $18.32, marking a decline of 3.12% for the day. The price currently sits below its key moving averages, reflecting sustained downside momentum.
 16.85
17.63
Highlights
- SoFi Technologies reported record second quarter loan originations totaling $14.8 billion, indicating substantial growth in business activity.
- Increased lending and member adoption suggest expanding core operations and future earnings potential for the company.
- Shares of SoFi Technologies trade below key moving averages with short-term pressure; expected to range from $17.64 to $19 in coming days, with a higher probability of a down move.
Expansion in loan originations fails to outweigh selling pressure
SoFi Technologies posted record Q2 loan originations of $14.8 billion, reflecting a substantial increase in business volume and product engagement, as reported by Simplywall. This growth in lending activity and member adoption signals expanding core operations and positions the company for future earnings momentum. The positive results have not offset the prevailing selling pressure in the stock.
Mixed signals from momentum and oversold conditions amid resistance
On the technical front, SOFI is currently trading below the MA-20 ($18.46) and MA-50 ($18.35) on the hourly chart, as well as below the MA-200 ($20.51) on the daily chart. The Ichimoku Kijun on the daily timeframe marks immediate resistance at $18.45. MACD and ADX both indicate buy signals, while RSI stands at 47.47 (pointing to a sell), and the Stochastic RSI is in oversold territory. CCI is neutral, Bull/Bear Power suggests intraday sellers are in control, and the Awesome Oscillator remains neutral.
Directional uncertainty heightened within tight volatility band
In the short term, SOFI is expected to trade within a range between $17.64 and $19. Over the next 2–3 trading days, there is a 53% probability of a move lower and a 47% chance of an upward direction, suggesting continued sideways price action within this volatility band. A break above $18.45 would pave the way for a bullish scenario, while a drop below $17.64 could trigger further losses.
Earlier, analysts noted that while institutional investment and strong fundamentals supported SoFi, technical signals pointed to continued caution. While current downside momentum persists, traders should closely monitor the $18.45 resistance and $17.64 support levels for potential breakouts that could define the next directional move.










-
 Afghanistan
-
 Albania
-
 Algeria
-
 Angola
-
 Argentina
-
 Armenia
-
 Australia
-
 Austria
-
 Azerbaijan
-
 Bahamas
-
 Bahrain
-
 Bangladesh
-
 Belarus
-
 Belgium
-
 Bolivia
-
 Botswana
-
 Brazil
-
 Brunei
-
 Bulgaria
-
 Cambodia
-
 Cameroon
-
 Canada
-
 Chile
-
 China
-
 Colombia
-
 Congo
-
 Costa Rica
-
 Cote d'Ivoire
-
 Croatia
-
 Cuba
-
 Cyprus
-
 Czechia
-
 DR Congo
-
 Denmark
-
 Dominican Republic
-
 Ecuador
-
 Egypt
-
 El Salvador
-
 Estonia
-
 Eswatini
-
 Ethiopia
-
 Finland
-
 France
-
 Georgia
-
 Germany
-
 Ghana
-
 Greece
-
 Haiti
-
 Hong Kong
-
 Hungary
-
 India
-
 Indonesia
-
 Iran, Islamic republic
-
 Iraq
-
 Ireland
-
 Israel
-
 Italy
-
 Jamaica
-
 Japan
-
 Jordan
-
 Kazakhstan
-
 Kenya
-
 Korea
-
 Kuwait
-
 Kyrgyzstan
-
 Laos
-
 Latvia
-
 Lebanon
-
 Lesotho
-
 Libya
-
 Lithuania
-
 Luxembourg
-
 Madagascar
-
 Malaysia
-
 Malta
-
 Mauritius
-
 Mexico
-
 Moldova
-
 Mongolia
-
 Montenegro
-
 Morocco
-
 Mozambique
-
 Myanmar
-
 Namibia
-
 Nepal
-
 Netherlands
-
 New Zealand
-
 Nigeria
-
 North Macedonia
-
 Norway
-
 Oman
-
 Pakistan
-
 Palestine
-
 Panama
-
 Papua New Guinea
-
 Paraguay
-
 Peru
-
 Philippines
-
 Poland
-
 Portugal
-
 Puerto Rico
-
 Qatar
-
 Reunion
-
 Romania
-
 Rwanda
-
 Saudi Arabia
-
 Serbia
-
 Singapore
-
 Slovakia
-
 Slovenia
-
 Somalia
-
 South Africa
-
 Spain
-
 Sri Lanka
-
 Sweden
-
 Switzerland
-
 Syria
-
 Taiwan
-
 Tajikistan
-
 Tanzania
-
 Thailand
-
 Trinidad and Tobago
-
 Tunisia
-
 Turkey
-
 UAE
-
 Uganda
-
 Ukraine
-
 United Kingdom
-
United States
-
 Uruguay
-
 Uzbekistan
-
 Venezuela
-
 Vietnam
-
 Yemen
-
 Zambia
-
 Zimbabwe
- Forex
- Crypto












