


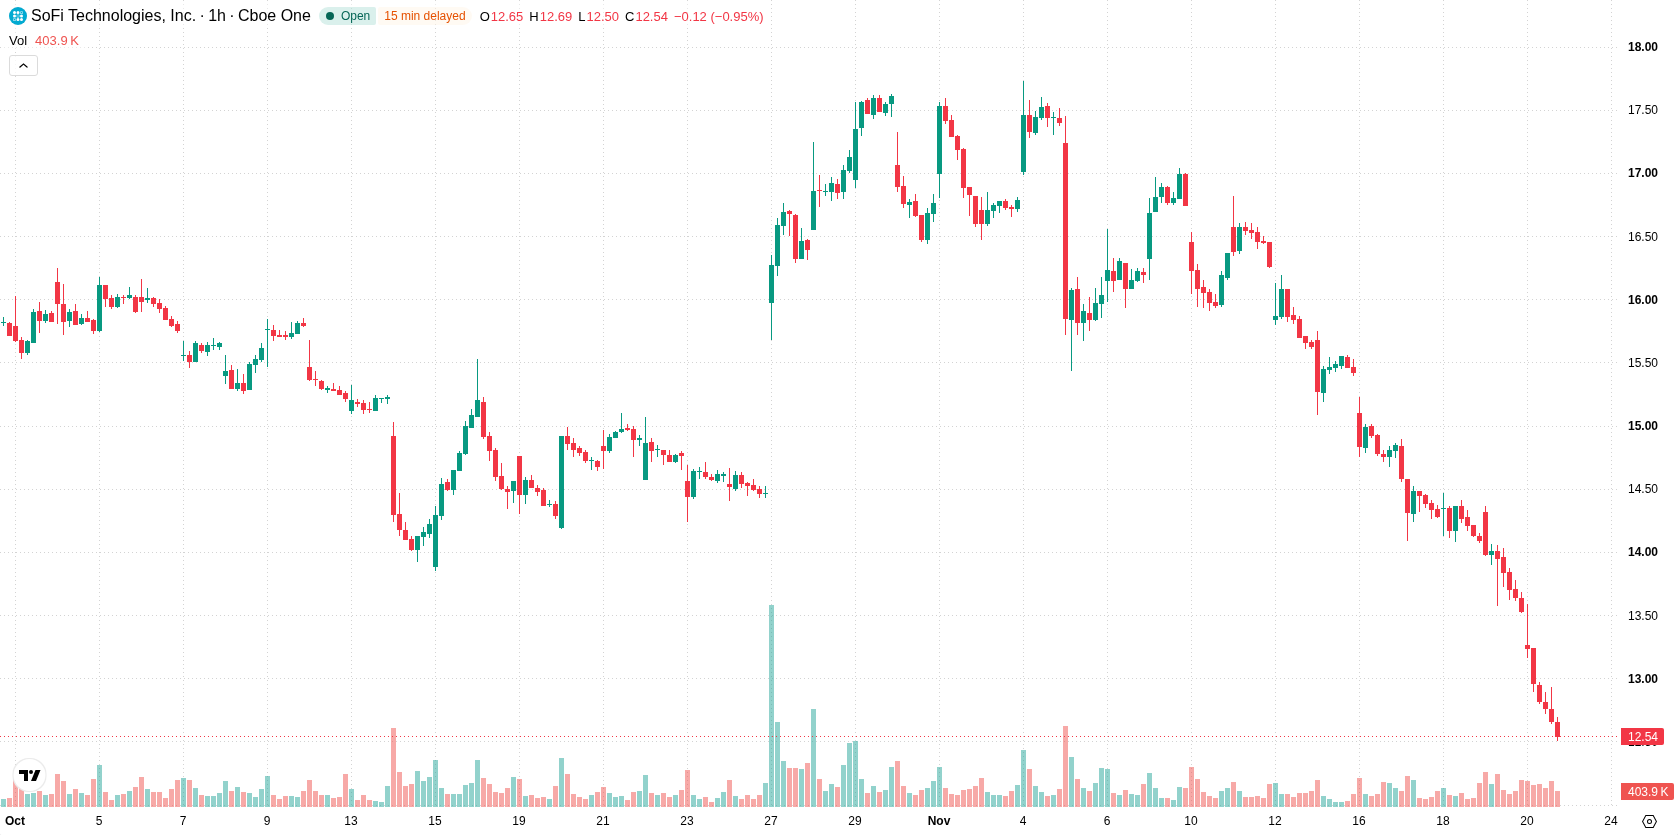
SoFi (SOFI) stock is trading at $12.53 after a sharp decline of 7.39% on the day. The price currently remains below its key moving averages, reflecting continued pressure from sellers.
 13.58
15.24
Highlights
- SoFi Technologies reported third-quarter adjusted earnings per share of $0.18 and adjusted revenue of $1.37 billion, up 44% year over year.
- The Public Sector Pension Investment Board acquired 1,699,000 shares of SoFi Technologies, totaling nearly $25.8 million in value.
- Shares of SoFi trade below key moving averages with sustained bearish momentum, a projected range of $11.76 to $13.3, and a high probability of further downside.
Strong earnings fail to offset persistent selling pressure
SoFi Technologies reported third-quarter adjusted earnings per share of $0.18 and adjusted revenue of $1.37 billion, a 44% year-over-year increase that demonstrates robust operational growth, according to Yahoo Finance. These financial results highlight the company's ability to expand revenue streams and improve profitability but were insufficient to shift current sentiment. Additionally, during the third quarter, the Public Sector Pension Investment Board acquired 1,699,000 shares of SoFi Technologies, valued at nearly $25.8 million, data from MarketBeat showed. Despite these developments, price action has remained under broader selling pressure.
Oversold readings and resistance limit amid pronounced downside momentum
On the technical front, SOFI/USD is trading below the H1 SMA-20 at $14.07, H1 SMA-50 at $14.91, and D1 SMA-200 at $17.17. The Ichimoku Kijun at $14.03 represents immediate resistance, while the latest session close near $12.53 aligns with pronounced downside volatility. MACD and ADX both signal continued selling momentum. RSI, Stochastic RSI, and CCI are deeply oversold, indicating potential for a technical bounce, while negative Bull/Bear Power and a bearish Awesome Oscillator reading confirm sellers' dominance.
Sideways trading expected as downside risk outweighs rebound
Looking ahead to the next 2–3 trading days, SOFI is expected to trade within a band of $11.76 to $13.3, reflecting a volatility band relative to current levels. The probability of an upward move remains very low, while a further decline is highly likely should support near $11.76 fail. The base case scenario anticipates sideways trading within this corridor, with a bullish scenario requiring a decisive move above immediate resistance and a bearish extension likely if support breaks.
Earlier, analysts noted that strong financial performance at SoFi was not enough to offset persistent technical and price pressures, leading to ongoing downside momentum. The current analysis reaffirms this trend while highlighting that a further decline below the $11.76 support could accelerate downside risk in the days ahead.










-
 Afghanistan
-
 Albania
-
 Algeria
-
 Angola
-
 Argentina
-
 Armenia
-
 Australia
-
 Austria
-
 Azerbaijan
-
 Bahamas
-
 Bahrain
-
 Bangladesh
-
 Belarus
-
 Belgium
-
 Bolivia
-
 Botswana
-
 Brazil
-
 Brunei
-
 Bulgaria
-
 Cambodia
-
 Cameroon
-
 Canada
-
 Chile
-
 China
-
 Colombia
-
 Congo
-
 Costa Rica
-
 Cote d'Ivoire
-
 Croatia
-
 Cuba
-
 Cyprus
-
 Czechia
-
 DR Congo
-
 Denmark
-
 Dominican Republic
-
 Ecuador
-
 Egypt
-
 El Salvador
-
 Estonia
-
 Eswatini
-
 Ethiopia
-
 Finland
-
 France
-
 Georgia
-
 Germany
-
 Ghana
-
 Greece
-
 Haiti
-
 Hong Kong
-
 Hungary
-
 India
-
 Indonesia
-
 Iran, Islamic republic
-
 Iraq
-
 Ireland
-
 Israel
-
 Italy
-
 Jamaica
-
 Japan
-
 Jordan
-
 Kazakhstan
-
 Kenya
-
 Korea
-
 Kuwait
-
 Kyrgyzstan
-
 Laos
-
 Latvia
-
 Lebanon
-
 Lesotho
-
 Libya
-
 Lithuania
-
 Luxembourg
-
 Madagascar
-
 Malaysia
-
 Malta
-
 Mauritius
-
 Mexico
-
 Moldova
-
 Mongolia
-
 Montenegro
-
 Morocco
-
 Mozambique
-
 Myanmar
-
 Namibia
-
 Nepal
-
 Netherlands
-
 New Zealand
-
 Nigeria
-
 North Macedonia
-
 Norway
-
 Oman
-
 Pakistan
-
 Palestine
-
 Panama
-
 Papua New Guinea
-
 Paraguay
-
 Peru
-
 Philippines
-
 Poland
-
 Portugal
-
 Puerto Rico
-
 Qatar
-
 Reunion
-
 Romania
-
 Rwanda
-
 Saudi Arabia
-
 Serbia
-
 Singapore
-
 Slovakia
-
 Slovenia
-
 Somalia
-
 South Africa
-
 Spain
-
 Sri Lanka
-
 Sweden
-
 Switzerland
-
 Syria
-
 Taiwan
-
 Tajikistan
-
 Tanzania
-
 Thailand
-
 Trinidad and Tobago
-
 Tunisia
-
 Turkey
-
 UAE
-
 Uganda
-
 Ukraine
-
 United Kingdom
-
United States
-
 Uruguay
-
 Uzbekistan
-
 Venezuela
-
 Vietnam
-
 Yemen
-
 Zambia
-
 Zimbabwe
- Forex
- Crypto












