

SoFi stock outlook: Bearish momentum dominates with risk toward $13.51 support

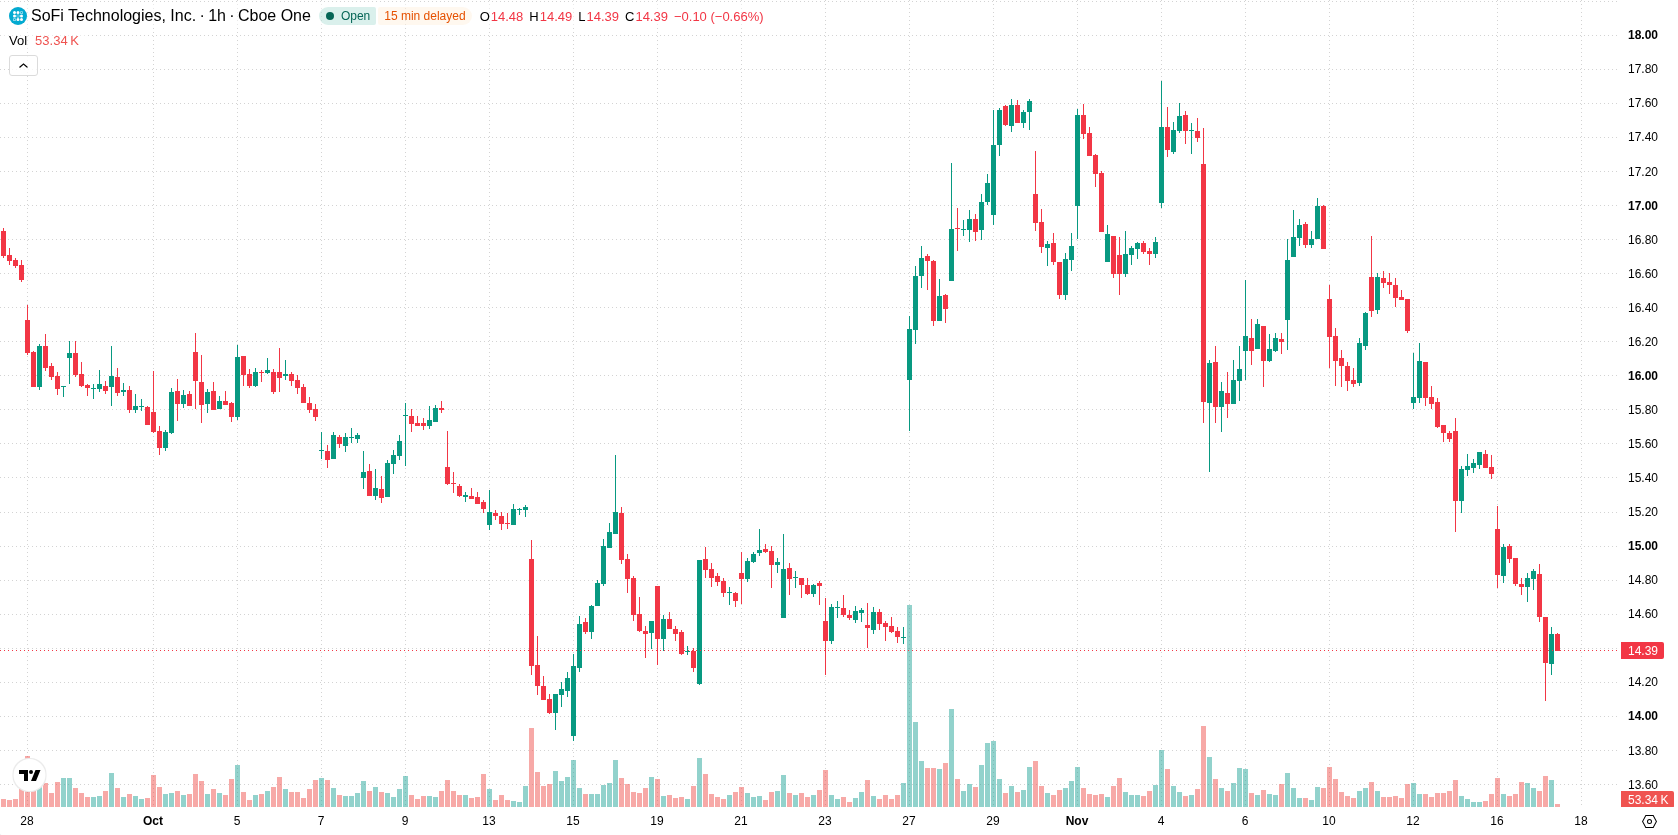
SoFi Technologies, Inc. (SOFI) stock is trading at $14.41, marking a daily decline of 2.9%. The price stands below its key moving averages, indicating sustained downward pressure relative to recent trend benchmarks.
 14.78
16.68
Highlights
- SoFi Technologies reported adjusted earnings per share of $0.18 on record revenue of $1.4 billion, with net income rising 73% to $241 million.
- The company added 1.2 million new members and grew loan originations by 71%, strengthening its business momentum and brand through external awards.
- Shares of SoFi trade with strong downside momentum, below key moving averages, and are expected to range from $13.51 to $15.31 over the next two to three days, with technical indicators showing oversold conditions and a high probability of further declines.
Profitability gains and record revenue amid persistent stock pressure
SoFi Technologies delivered strong quarterly results, reporting adjusted earnings per share of $0.18 and revenue of $1.385 billion, accompanied by growth of 1.2 million new members and a 71% rise in loan originations. Net income advanced 73% year over year to $241 million, and revenue set a new record at $1.4 billion, as highlighted by Fool, reflecting an acceleration in both profitability and business momentum. Additionally, SoFi Bank received external recognition as the 'Best Online Bank of 2026' for its high-yield and fee-free offerings, adding to the company's brand reputation, though price action has remained under broader selling pressure.
Sustained technical weakness as sell signals outweigh oversold readings
On the technical front, SOFI is currently trading below H1 SMA-20 at $15.25, H1 SMA-50 at $15.92, and D1 SMA-200 at $17.28. The Ichimoku Kijun at $15.62 acts as immediate resistance. MACD and ADX both signal prevailing selling pressure, while RSI and CCI are in oversold territory and Stochastic RSI is neutral. Bull/Bear Power remains negative, pointing to ongoing intraday seller dominance.
Downside favored as price action remains capped within volatility band
Looking ahead to the next 2–3 trading days, SOFI is likely to trade within the $13.51 to $15.31 volatility band. The odds of an immediate upward move are very low, with downward continuation considered substantially more probable. The baseline scenario calls for continued sideways action inside this range, with a bullish recovery only possible above short-term resistance, and deeper declines favored if price breaks the lower support level.
Earlier, analysts noted that SoFi Technologies faced persistent downward pressure despite positive business developments and strong fundamentals. The latest data reinforce this view, as ongoing technical weakness underscores that traders should monitor the $13.51 support level for early signs of any further downside risk.











-
 Afghanistan
-
 Albania
-
 Algeria
-
 Angola
-
 Argentina
-
 Armenia
-
 Australia
-
 Austria
-
 Azerbaijan
-
 Bahamas
-
 Bahrain
-
 Bangladesh
-
 Belarus
-
 Belgium
-
 Bolivia
-
 Botswana
-
 Brazil
-
 Brunei
-
 Bulgaria
-
 Cambodia
-
 Cameroon
-
 Canada
-
 Chile
-
 China
-
 Colombia
-
 Congo
-
 Costa Rica
-
 Cote d'Ivoire
-
 Croatia
-
 Cuba
-
 Cyprus
-
 Czechia
-
 DR Congo
-
 Denmark
-
 Dominican Republic
-
 Ecuador
-
 Egypt
-
 El Salvador
-
 Estonia
-
 Eswatini
-
 Ethiopia
-
 Finland
-
 France
-
 Georgia
-
 Germany
-
 Ghana
-
 Greece
-
 Haiti
-
 Hong Kong
-
 Hungary
-
 India
-
 Indonesia
-
 Iran, Islamic republic
-
 Iraq
-
 Ireland
-
 Israel
-
 Italy
-
 Jamaica
-
 Japan
-
 Jordan
-
 Kazakhstan
-
 Kenya
-
 Korea
-
 Kuwait
-
 Kyrgyzstan
-
 Laos
-
 Latvia
-
 Lebanon
-
 Lesotho
-
 Libya
-
 Lithuania
-
 Luxembourg
-
 Madagascar
-
 Malaysia
-
 Malta
-
 Mauritius
-
 Mexico
-
 Moldova
-
 Mongolia
-
 Montenegro
-
 Morocco
-
 Mozambique
-
 Myanmar
-
 Namibia
-
 Nepal
-
 Netherlands
-
 New Zealand
-
 Nigeria
-
 North Macedonia
-
 Norway
-
 Oman
-
 Pakistan
-
 Palestine
-
 Panama
-
 Papua New Guinea
-
 Paraguay
-
 Peru
-
 Philippines
-
 Poland
-
 Portugal
-
 Puerto Rico
-
 Qatar
-
 Reunion
-
 Romania
-
 Rwanda
-
 Saudi Arabia
-
 Serbia
-
 Singapore
-
 Slovakia
-
 Slovenia
-
 Somalia
-
 South Africa
-
 Spain
-
 Sri Lanka
-
 Sweden
-
 Switzerland
-
 Syria
-
 Taiwan
-
 Tajikistan
-
 Tanzania
-
 Thailand
-
 Trinidad and Tobago
-
 Tunisia
-
 Turkey
-
 UAE
-
 Uganda
-
 Ukraine
-
 United Kingdom
-
United States
-
 Uruguay
-
 Uzbekistan
-
 Venezuela
-
 Vietnam
-
 Yemen
-
 Zambia
-
 Zimbabwe
- Forex
- Crypto












