

Will SoFi stock avoid deeper losses amid prevailing seller pressure?

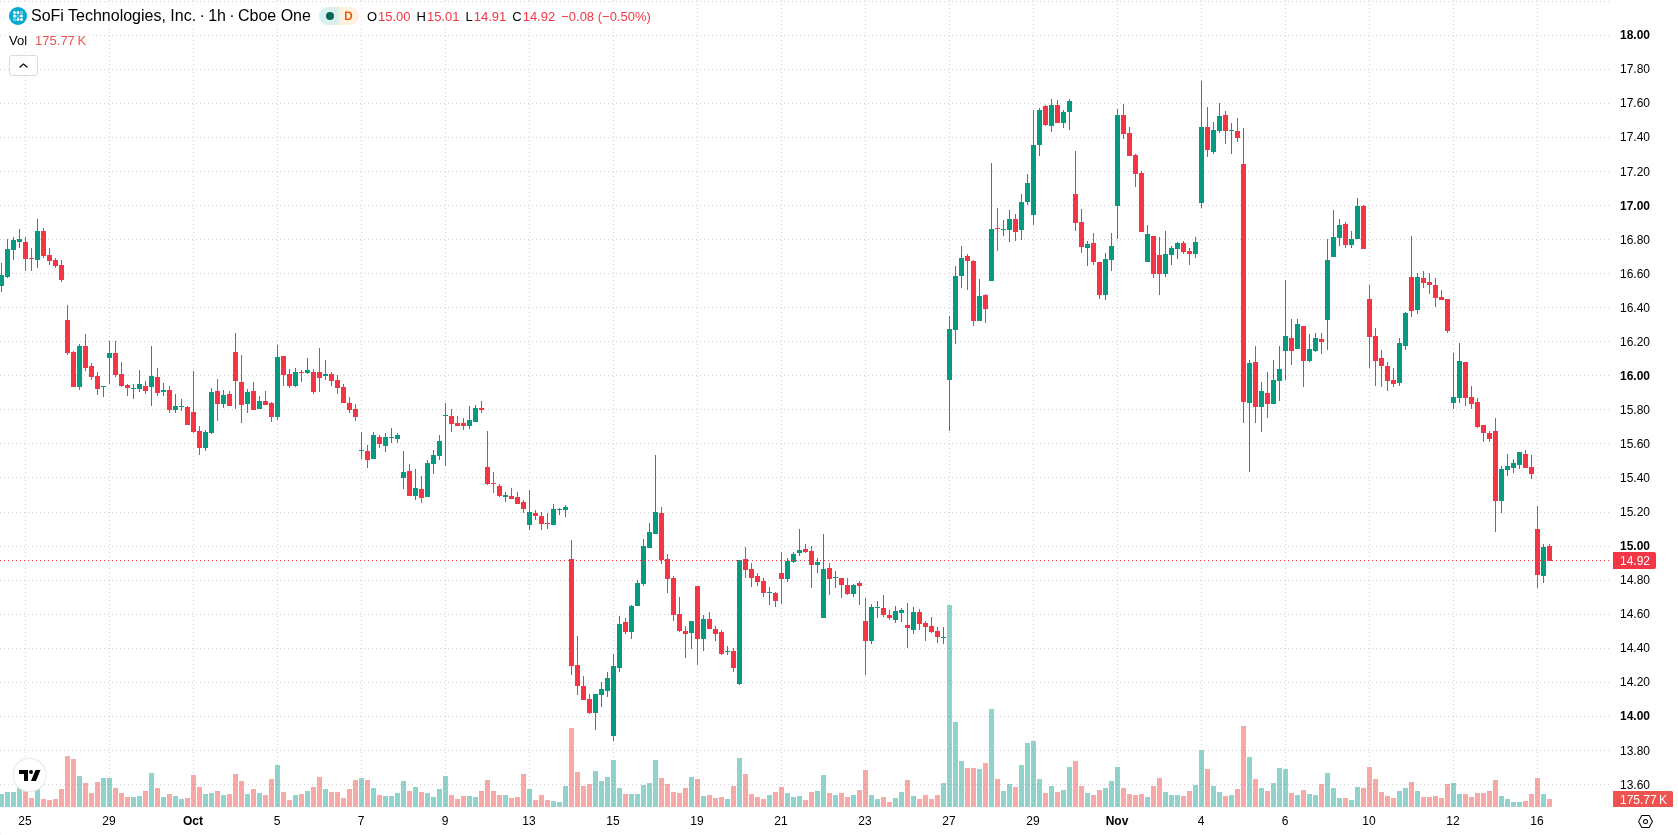
SoFi Technologies, Inc. (SOFI) stock is trading at $14.92, down 3.31% on the day. The price remains below its key moving averages, reflecting ongoing bearish momentum.
 15.11
16.68
Highlights
- SoFi Technologies net income rose 73% to $241 million and revenue climbed 44% to $1.4 billion in the third quarter.
- The company took part in distributing shares for the Anthropic IPO, indicating involvement in significant capital markets transactions.
- Shares of SoFi trade below key average price levels with strong selling pressures; the price is expected to consolidate between $14.21 and $15.63.
Robust earnings and capital markets activity as price faces selling
SoFi Technologies reported record third-quarter results, with net income climbing 73% year over year to $241 million and revenue increasing 44% to $1.4 billion, demonstrating strong operational performance for the period. This robust earnings backdrop provides a foundation for fundamental valuation, even as market sentiment remains cautious. Additionally, the company participated in distributing shares during the Anthropic IPO, signaling involvement in major capital markets activities, as reported by FinanceFeeds. All recent developments have been fundamentally positive, though price action has remained under broader selling pressure.
Technical resistance compounds negative momentum amid oversold signals
SOFI is trading below the H1 SMA-20 at $15.75, H1 SMA-50 at $16.08, and D1 SMA-200 at $17.32. The Ichimoku Kijun sits at $15.91, serving as immediate resistance for any attempt to retrace higher. Momentum signals are decisively negative: both MACD and ADX remain on Sell status, while RSI, Stoch RSI, and CCI have all dropped into their oversold territories. Bull/Bear Power is at -0.34, confirming intraday control by sellers. The Awesome Oscillator remains neutral, and price action has opened a negative gap of 0.35, reflecting moderate volatility within the mid-range.
Sideways consolidation expected as downside risk dominates outlook
Over the coming sessions, the expected trading range is $14.21 to $15.63, defining the short-term volatility band relative to current levels. The probability of a further decline is rated as very high, while a scenario of a meaningful upward move is considered very unlikely. The baseline expectation is for SOFI to consolidate sideways within this band; a bullish breakout would require a sustained move above immediate resistance, while a break below support at $14.21 could trigger additional downside.
Earlier, analysts noted that SoFi Technologies remained under persistent downside pressure despite ongoing efforts to expand its digital asset ecosystem. The current analysis reinforces this view, with updated technical signals pointing to a high likelihood of further declines and a need for traders to monitor the $14.21 support level as a critical threshold for additional downside risk.











-
 Afghanistan
-
 Albania
-
 Algeria
-
 Angola
-
 Argentina
-
 Armenia
-
 Australia
-
 Austria
-
 Azerbaijan
-
 Bahamas
-
 Bahrain
-
 Bangladesh
-
 Belarus
-
 Belgium
-
 Bolivia
-
 Botswana
-
 Brazil
-
 Brunei
-
 Bulgaria
-
 Cambodia
-
 Cameroon
-
 Canada
-
 Chile
-
 China
-
 Colombia
-
 Congo
-
 Costa Rica
-
 Cote d'Ivoire
-
 Croatia
-
 Cuba
-
 Cyprus
-
 Czechia
-
 DR Congo
-
 Denmark
-
 Dominican Republic
-
 Ecuador
-
 Egypt
-
 El Salvador
-
 Estonia
-
 Eswatini
-
 Ethiopia
-
 Finland
-
 France
-
 Georgia
-
 Germany
-
 Ghana
-
 Greece
-
 Haiti
-
 Hong Kong
-
 Hungary
-
 India
-
 Indonesia
-
 Iran, Islamic republic
-
 Iraq
-
 Ireland
-
 Israel
-
 Italy
-
 Jamaica
-
 Japan
-
 Jordan
-
 Kazakhstan
-
 Kenya
-
 Korea
-
 Kuwait
-
 Kyrgyzstan
-
 Laos
-
 Latvia
-
 Lebanon
-
 Lesotho
-
 Libya
-
 Lithuania
-
 Luxembourg
-
 Madagascar
-
 Malaysia
-
 Malta
-
 Mauritius
-
 Mexico
-
 Moldova
-
 Mongolia
-
 Montenegro
-
 Morocco
-
 Mozambique
-
 Myanmar
-
 Namibia
-
 Nepal
-
 Netherlands
-
 New Zealand
-
 Nigeria
-
 North Macedonia
-
 Norway
-
 Oman
-
 Pakistan
-
 Palestine
-
 Panama
-
 Papua New Guinea
-
 Paraguay
-
 Peru
-
 Philippines
-
 Poland
-
 Portugal
-
 Puerto Rico
-
 Qatar
-
 Reunion
-
 Romania
-
 Rwanda
-
 Saudi Arabia
-
 Serbia
-
 Singapore
-
 Slovakia
-
 Slovenia
-
 Somalia
-
 South Africa
-
 Spain
-
 Sri Lanka
-
 Sweden
-
 Switzerland
-
 Syria
-
 Taiwan
-
 Tajikistan
-
 Tanzania
-
 Thailand
-
 Trinidad and Tobago
-
 Tunisia
-
 Turkey
-
 UAE
-
 Uganda
-
 Ukraine
-
 United Kingdom
-
United States
-
 Uruguay
-
 Uzbekistan
-
 Venezuela
-
 Vietnam
-
 Yemen
-
 Zambia
-
 Zimbabwe
- Forex
- Crypto












