

SoFi stock falls around 4.5% as institutional buying meets broader selling pressure

SoFi Technologies, Inc. (SOFI) dropped 4.51% after opening with a downside gap, with recent institutional purchases—including ARK Investment Management's $6.8 million buy—providing a backdrop for today's retreat. The down move is supported by SoFi trading above its 20-day average but remaining below key medium- and long-term moving averages, signaling persistent selling pressure.
 15.75
17.04
Highlights
- ARK Investment Management acquired $6.8 million in SoFi shares within its innovation-focused ETFs in November 2026.
- SoFi reported strong revenue and deposit growth, growing its member base and seeing greater multi-product use.
- SoFi stock trades between $14.88 and $17.13 with technical signals mixed and a 70% probability of an upward move.
ARK purchases offset by persistent selling as new user incentives launch
ARK Investment Management purchased approximately $6.8 million in SoFi shares across its ARK Innovation ETF and ARK Blockchain & Fintech Innovation ETF in November 2026. The company reported strong revenue and deposit growth, with ongoing expansion of its member base and increased multi-product adoption. A limited-time promotion for new Active Invest users offering up to $1,000 in stock with a $50 deposit was also introduced, though price action has remained under broader selling pressure.
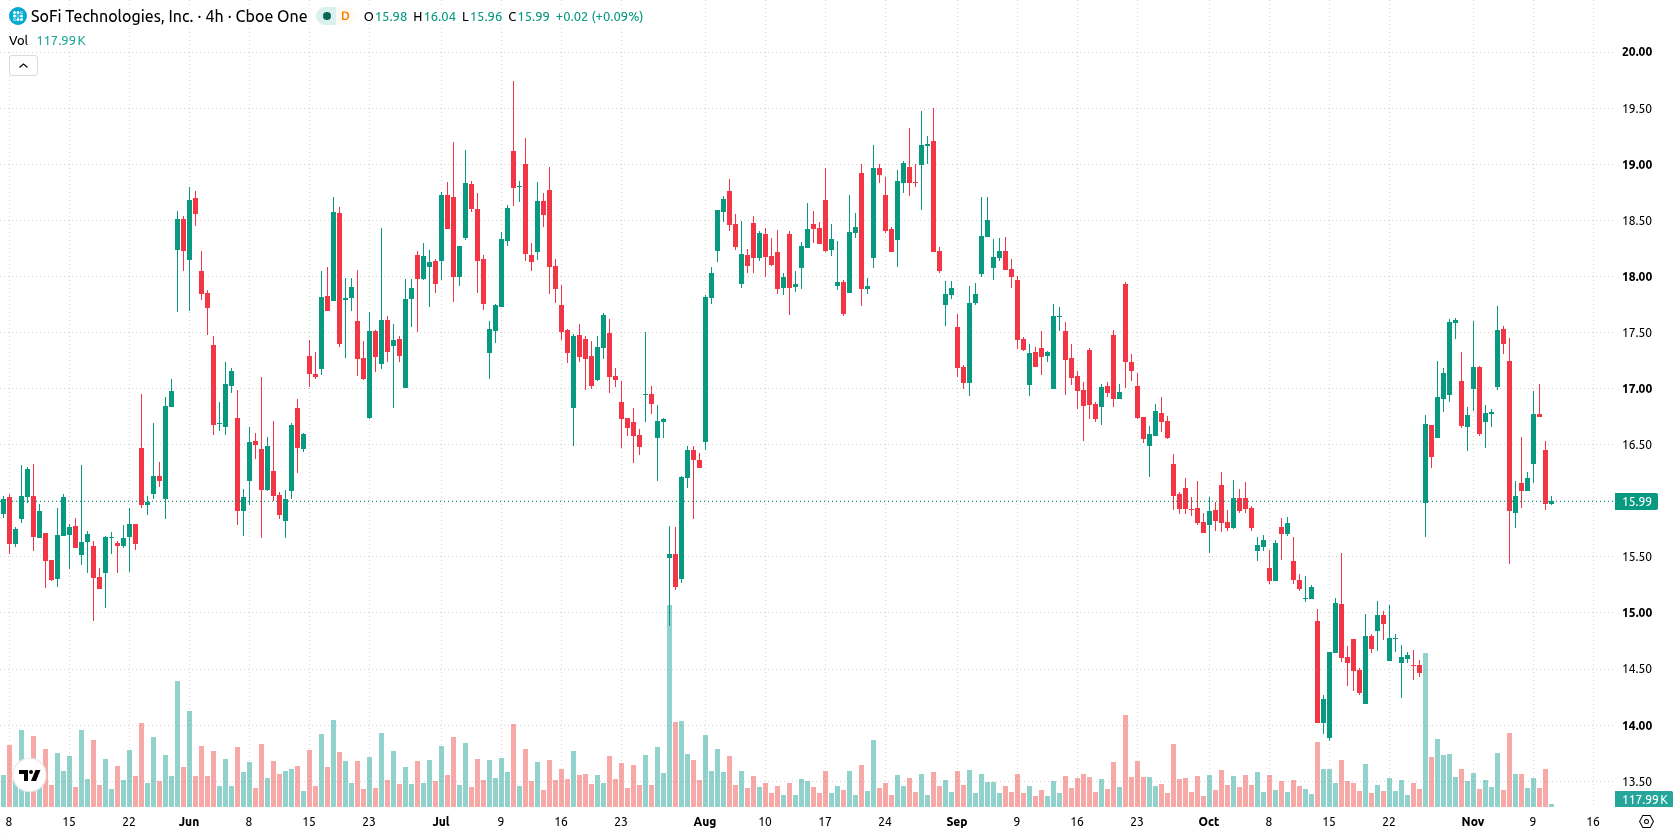
Neutral momentum signals as SoFi tests medium-term resistance
SoFi trades above its 20-day moving average at $15.73 but remains below both the 50-day ($16.33) and the 200-day ($17.51) averages, indicating short-term support with ongoing medium- and long-term selling pressure. The near-term ceiling is at $16.15, while support is defined by the Ichimoku Kijun at $15.82. A bearish alignment between the 50-day and 200-day averages confirms a longer-term downtrend. MACD and Average Directional Index (ADX) indicate sustained buy signals, yet all three oscillators—RSI, Stochastic RSI, and Commodity Channel Index (CCI)—are in neutral zones. Bull/Bear Power (BBP) is positive, pointing to intraday buyer dominance. SoFi last traded near its daily low within a wide intraday range, with volatility amplitude at 5.51%. Downside pressure persisted throughout the session, consistent with neutral oscillator readings.
Previously it was reported that SoFi remained under broad selling pressure despite notable institutional purchases and neutral technical indicators. With new data showing a shift toward short-term consolidation and increased volatility, traders should now pay close attention to the $15.82 support and $16.15 resistance for potential breakout or breakdown signals.










-
 Afghanistan
-
 Albania
-
 Algeria
-
 Angola
-
 Argentina
-
 Armenia
-
 Australia
-
 Austria
-
 Azerbaijan
-
 Bahamas
-
 Bahrain
-
 Bangladesh
-
 Belarus
-
 Belgium
-
 Bolivia
-
 Botswana
-
 Brazil
-
 Brunei
-
 Bulgaria
-
 Cambodia
-
 Cameroon
-
 Canada
-
 Chile
-
 China
-
 Colombia
-
 Congo
-
 Costa Rica
-
 Cote d'Ivoire
-
 Croatia
-
 Cuba
-
 Cyprus
-
 Czechia
-
 DR Congo
-
 Denmark
-
 Dominican Republic
-
 Ecuador
-
 Egypt
-
 El Salvador
-
 Estonia
-
 Eswatini
-
 Ethiopia
-
 Finland
-
 France
-
 Georgia
-
 Germany
-
 Ghana
-
 Greece
-
 Haiti
-
 Hong Kong
-
 Hungary
-
 India
-
 Indonesia
-
 Iran, Islamic republic
-
 Iraq
-
 Ireland
-
 Israel
-
 Italy
-
 Jamaica
-
 Japan
-
 Jordan
-
 Kazakhstan
-
 Kenya
-
 Korea
-
 Kuwait
-
 Kyrgyzstan
-
 Laos
-
 Latvia
-
 Lebanon
-
 Lesotho
-
 Libya
-
 Lithuania
-
 Luxembourg
-
 Madagascar
-
 Malaysia
-
 Malta
-
 Mauritius
-
 Mexico
-
 Moldova
-
 Mongolia
-
 Montenegro
-
 Morocco
-
 Mozambique
-
 Myanmar
-
 Namibia
-
 Nepal
-
 Netherlands
-
 New Zealand
-
 Nigeria
-
 North Macedonia
-
 Norway
-
 Oman
-
 Pakistan
-
 Palestine
-
 Panama
-
 Papua New Guinea
-
 Paraguay
-
 Peru
-
 Philippines
-
 Poland
-
 Portugal
-
 Puerto Rico
-
 Qatar
-
 Reunion
-
 Romania
-
 Rwanda
-
 Saudi Arabia
-
 Serbia
-
 Singapore
-
 Slovakia
-
 Slovenia
-
 Somalia
-
 South Africa
-
 Spain
-
 Sri Lanka
-
 Sweden
-
 Switzerland
-
 Syria
-
 Taiwan
-
 Tajikistan
-
 Tanzania
-
 Thailand
-
 Trinidad and Tobago
-
 Tunisia
-
 Turkey
-
 UAE
-
 Uganda
-
 Ukraine
-
 United Kingdom
-
United States
-
 Uruguay
-
 Uzbekistan
-
 Venezuela
-
 Vietnam
-
 Yemen
-
 Zambia
-
 Zimbabwe
- Forex
- Crypto












