

SOFI retreats over 5% as downside momentum persists and technical signals remain bearish

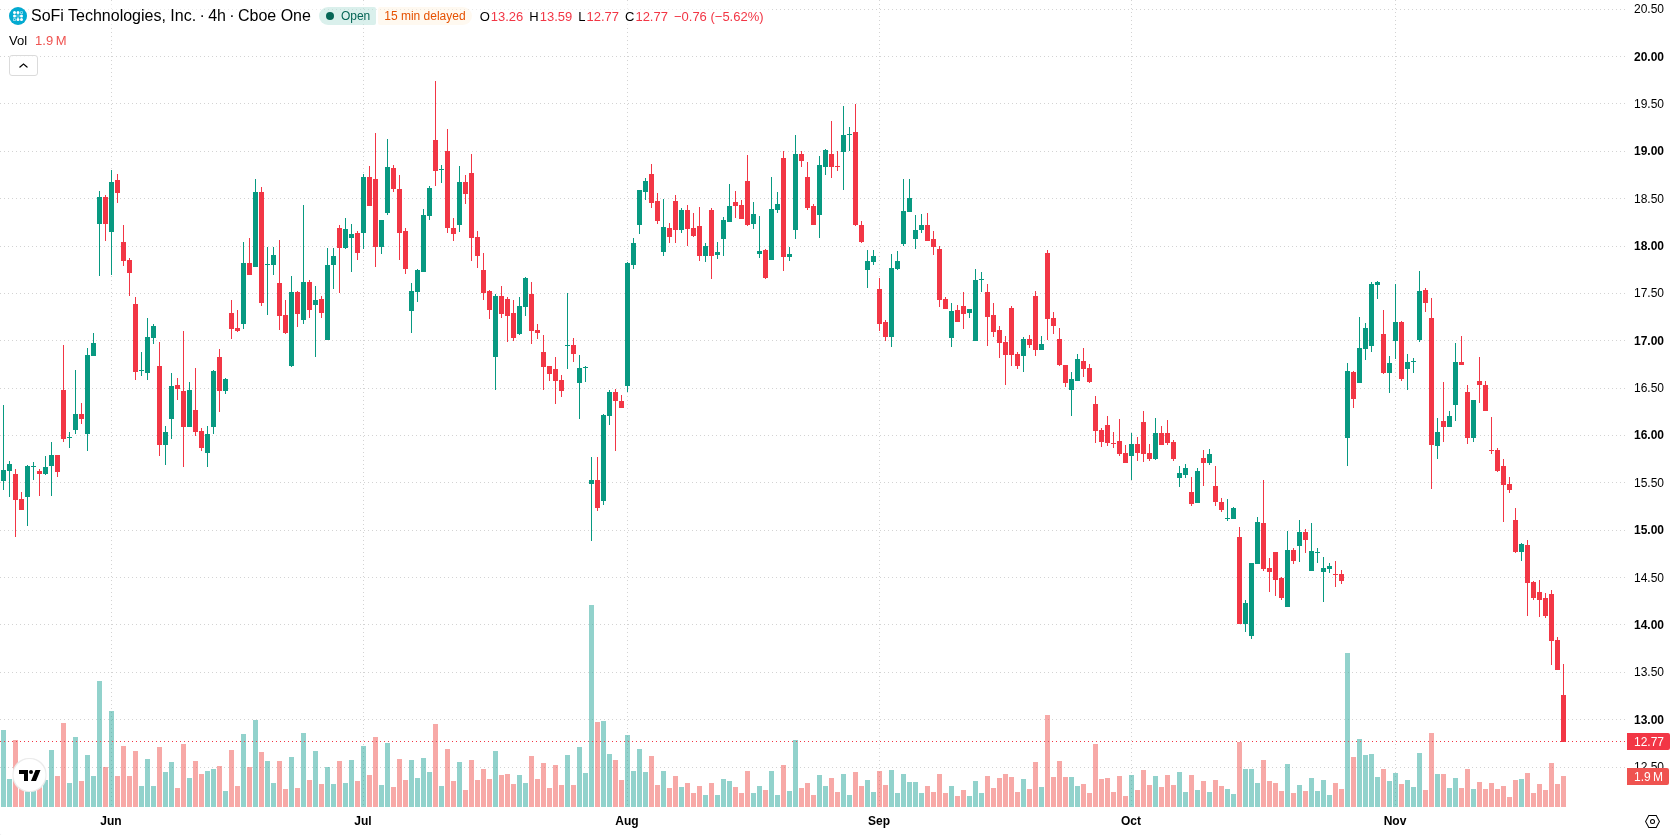
SoFi Technologies, Inc (SOFI) declined 5.36% today as higher interest rates drove caution across U.S. financial stocks. The move is supported by persistent downside momentum, with the stock trading below all key moving averages.
 13.58
15.24
Highlights
- SoFi achieved profitability and recorded 42% revenue growth over the past twelve months.
- Shares of SoFi fell, reducing its market capitalization by about $4.2 billion amid persistent interest rate concerns and a multi-day decline in U.S. financial stocks.
- SoFi stock trades below major moving averages, with technical momentum widely bearish and an expected five-day range of $11.95 to $13.67.
Profit milestone eclipsed by sector selloff amid Treasury yield surge
SoFi reported 42% revenue growth over the last twelve months and achieved profitability, as shown by recent InvestingPro data. The share price drop coincided with mounting market concerns over elevated interest rates, with the 10-year Treasury yield approaching 5.10%. These factors were accompanied by an eight-day slide in U.S. financial stocks that reduced SoFi's market capitalization by approximately $4.2 billion.
Downward momentum confirmed as SoFi trades below all key averages
SoFi is currently trading at $12.81, sitting below its 20-, 50-, and 200-day moving averages at $15.87, $15.9, and $17.17, respectively. This alignment signals continued downward pressure across short-, medium-, and long-term trends. Immediate resistance is set at $13.52, with the next key support at $11.95. Technical momentum is weak: the MACD signals a sell, ADX reads neutral, and the RSI is neutral. Both the Stochastic RSI and Commodity Channel Index (CCI) confirm oversold conditions. Bull/Bear Power remains negative, indicating ongoing seller dominance in intraday momentum. The Awesome Oscillator corroborates a bearish bias. SoFi is down $0.725 or 5.36% today, having opened with a 5.69% upside gap before returning to session lows. Intraday volatility is 6.29%, and sellers have exerted steady pressure since the open, with all momentum signals aligned to the downside except for oversold signals hinting at potential short-lived rebounds.
Earlier, analysts noted that SoFi's strong financial performance had not been enough to overcome persistent technical and price pressure. The current analysis reinforces this dynamic, highlighting the importance of the $11.95 support as a critical level for traders monitoring near-term downside risk.










-
 Afghanistan
-
 Albania
-
 Algeria
-
 Angola
-
 Argentina
-
 Armenia
-
 Australia
-
 Austria
-
 Azerbaijan
-
 Bahamas
-
 Bahrain
-
 Bangladesh
-
 Belarus
-
 Belgium
-
 Bolivia
-
 Botswana
-
 Brazil
-
 Brunei
-
 Bulgaria
-
 Cambodia
-
 Cameroon
-
 Canada
-
 Chile
-
 China
-
 Colombia
-
 Congo
-
 Costa Rica
-
 Cote d'Ivoire
-
 Croatia
-
 Cuba
-
 Cyprus
-
 Czechia
-
 DR Congo
-
 Denmark
-
 Dominican Republic
-
 Ecuador
-
 Egypt
-
 El Salvador
-
 Estonia
-
 Eswatini
-
 Ethiopia
-
 Finland
-
 France
-
 Georgia
-
 Germany
-
 Ghana
-
 Greece
-
 Haiti
-
 Hong Kong
-
 Hungary
-
 India
-
 Indonesia
-
 Iran, Islamic republic
-
 Iraq
-
 Ireland
-
 Israel
-
 Italy
-
 Jamaica
-
 Japan
-
 Jordan
-
 Kazakhstan
-
 Kenya
-
 Korea
-
 Kuwait
-
 Kyrgyzstan
-
 Laos
-
 Latvia
-
 Lebanon
-
 Lesotho
-
 Libya
-
 Lithuania
-
 Luxembourg
-
 Madagascar
-
 Malaysia
-
 Malta
-
 Mauritius
-
 Mexico
-
 Moldova
-
 Mongolia
-
 Montenegro
-
 Morocco
-
 Mozambique
-
 Myanmar
-
 Namibia
-
 Nepal
-
 Netherlands
-
 New Zealand
-
 Nigeria
-
 North Macedonia
-
 Norway
-
 Oman
-
 Pakistan
-
 Palestine
-
 Panama
-
 Papua New Guinea
-
 Paraguay
-
 Peru
-
 Philippines
-
 Poland
-
 Portugal
-
 Puerto Rico
-
 Qatar
-
 Reunion
-
 Romania
-
 Rwanda
-
 Saudi Arabia
-
 Serbia
-
 Singapore
-
 Slovakia
-
 Slovenia
-
 Somalia
-
 South Africa
-
 Spain
-
 Sri Lanka
-
 Sweden
-
 Switzerland
-
 Syria
-
 Taiwan
-
 Tajikistan
-
 Tanzania
-
 Thailand
-
 Trinidad and Tobago
-
 Tunisia
-
 Turkey
-
 UAE
-
 Uganda
-
 Ukraine
-
 United Kingdom
-
United States
-
 Uruguay
-
 Uzbekistan
-
 Venezuela
-
 Vietnam
-
 Yemen
-
 Zambia
-
 Zimbabwe
- Forex
- Crypto












