


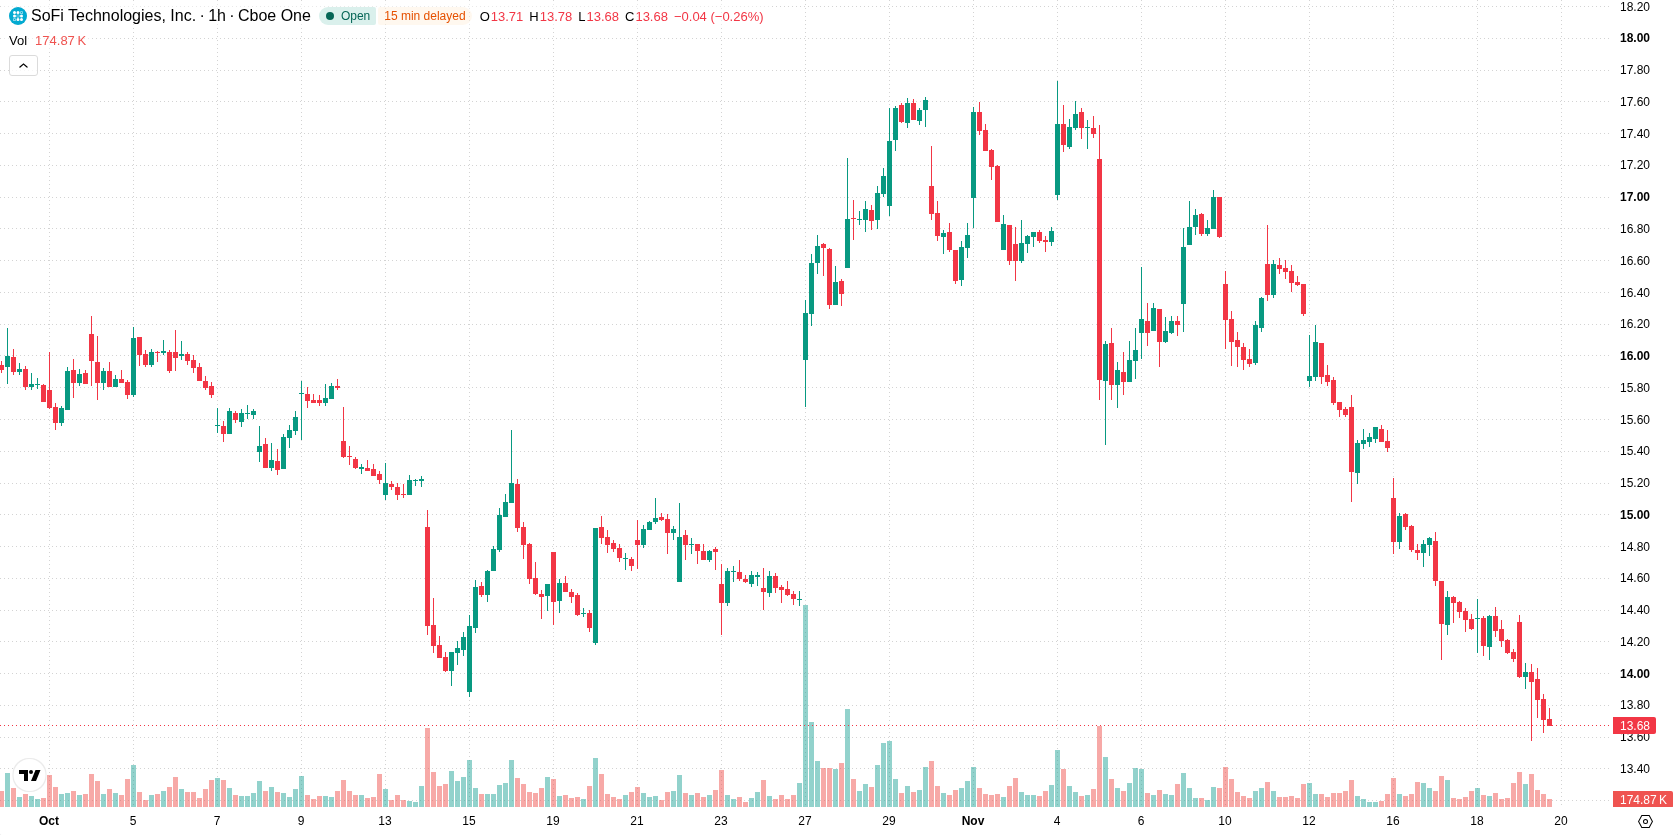
SoFi (SOFI) stock is trading at $13.64, marking a 3.3% decline compared to the previous session and reflecting ongoing downward momentum. The price remains below its key moving averages, signaling persistent selling pressure on both intraday and longer-term horizons.
 14.37
15.75
Highlights
- SoFi Technologies reported a 44% year-over-year increase in adjusted revenue to $1.37 billion for the third quarter.
- The company raised its full-year 2026 guidance and provided a 2027 outlook that surpassed Wall Street estimates.
- Shares of SoFi remain under strong selling pressure, trading below key averages, with high probability of moving down into the $12.89 to $14.39 range over the next several days.
Strong revenue and outlook beaten by persistent negative price action
SoFi Technologies reported a 44% year-over-year increase in adjusted revenue to $1.37 billion for the third quarter, with adjusted earnings per share of $0.18, according to Investing.com. The company also raised its full-year 2026 guidance and issued a 2027 outlook that exceeded Wall Street estimates, as noted by TradingView. Despite these strong operating results and improved forward guidance, price action has remained under broader selling pressure.
Sustained technical weakness as indicators reinforce pressure below resistance
Technically, SOFI is trading below the H1 SMA-20 at $14.42, the H1 SMA-50 at $15.26, and the D1 SMA-200 at $17.20. The Ichimoku Kijun at $14.82 remains a key resistance level overhead. Momentum indicators show a strong sell signal from MACD and a sell signal from ADX, while RSI and CCI sit in neutral zones. Stoch RSI is overbought, indicating possible short-term overheating, and Bull/Bear Power is slightly positive at 0.02. The Awesome Oscillator is neutral, highlighting a balance between buyers and sellers intraday, though the overall signal set leans toward continued pressure.
High downside risk as consolidation expected within volatility band
Over the next 2–3 sessions, SOFI is expected to consolidate within the $12.89 to $14.39 volatility band relative to current levels. Downside probability is rated very high, with a potential move lower if sellers push decisively below the $12.89 support. A bullish scenario would require a breakout above immediate resistance near $14.82, but such an outcome remains unlikely given prevailing short-term signals.
Earlier, analysts noted that SoFi Technologies' strong financial performance had not translated into positive price momentum, with technical signals pointing to persistent downward pressure. The current data reinforce this trend, highlighting $12.89 as a critical support level for traders to monitor in the near term.










-
 Afghanistan
-
 Albania
-
 Algeria
-
 Angola
-
 Argentina
-
 Armenia
-
 Australia
-
 Austria
-
 Azerbaijan
-
 Bahamas
-
 Bahrain
-
 Bangladesh
-
 Belarus
-
 Belgium
-
 Bolivia
-
 Botswana
-
 Brazil
-
 Brunei
-
 Bulgaria
-
 Cambodia
-
 Cameroon
-
 Canada
-
 Chile
-
 China
-
 Colombia
-
 Congo
-
 Costa Rica
-
 Cote d'Ivoire
-
 Croatia
-
 Cuba
-
 Cyprus
-
 Czechia
-
 DR Congo
-
 Denmark
-
 Dominican Republic
-
 Ecuador
-
 Egypt
-
 El Salvador
-
 Estonia
-
 Eswatini
-
 Ethiopia
-
 Finland
-
 France
-
 Georgia
-
 Germany
-
 Ghana
-
 Greece
-
 Haiti
-
 Hong Kong
-
 Hungary
-
 India
-
 Indonesia
-
 Iran, Islamic republic
-
 Iraq
-
 Ireland
-
 Israel
-
 Italy
-
 Jamaica
-
 Japan
-
 Jordan
-
 Kazakhstan
-
 Kenya
-
 Korea
-
 Kuwait
-
 Kyrgyzstan
-
 Laos
-
 Latvia
-
 Lebanon
-
 Lesotho
-
 Libya
-
 Lithuania
-
 Luxembourg
-
 Madagascar
-
 Malaysia
-
 Malta
-
 Mauritius
-
 Mexico
-
 Moldova
-
 Mongolia
-
 Montenegro
-
 Morocco
-
 Mozambique
-
 Myanmar
-
 Namibia
-
 Nepal
-
 Netherlands
-
 New Zealand
-
 Nigeria
-
 North Macedonia
-
 Norway
-
 Oman
-
 Pakistan
-
 Palestine
-
 Panama
-
 Papua New Guinea
-
 Paraguay
-
 Peru
-
 Philippines
-
 Poland
-
 Portugal
-
 Puerto Rico
-
 Qatar
-
 Reunion
-
 Romania
-
 Rwanda
-
 Saudi Arabia
-
 Serbia
-
 Singapore
-
 Slovakia
-
 Slovenia
-
 Somalia
-
 South Africa
-
 Spain
-
 Sri Lanka
-
 Sweden
-
 Switzerland
-
 Syria
-
 Taiwan
-
 Tajikistan
-
 Tanzania
-
 Thailand
-
 Trinidad and Tobago
-
 Tunisia
-
 Turkey
-
 UAE
-
 Uganda
-
 Ukraine
-
 United Kingdom
-
United States
-
 Uruguay
-
 Uzbekistan
-
 Venezuela
-
 Vietnam
-
 Yemen
-
 Zambia
-
 Zimbabwe
- Forex
- Crypto












