

EQT climbs nearly 4% after bullish momentum from technical break and asset manager inflows

EQT Corporation (EQT) surged 3.98% after new institutional filings highlighted increased investment from asset managers, signaling robust market demand. The uptrend is supported in the short and medium term by the stock trading above its 20- and 50-day moving averages, although resistance remains from the longer-term structure, with price still just below the 200-day mark.
 51.30
55.56
Highlights
- Northwestern Mutual Wealth Management and other large asset managers have started or increased positions in EQT, totaling $2.03 million by late August 2026.
- EQT's integrated infrastructure and operational efficiencies have enabled it to fund drilling, manage debt, and return capital to shareholders.
- Shares of EQT have advanced 3.98% to $56.15 with bullish short-term momentum, trading near resistance at $56.32 and an expected five-day range of $54.15 to $57.2.
Institutional allocations rise as gas infrastructure narrative boosts confidence
Recent filings reveal that major asset managers, including Northwestern Mutual Wealth Management Co., have started or increased positions in EQT, with a reported $2.03 million investment as of late August 2026. This activity reflects ongoing confidence in EQT's exposure to U.S. natural gas, its integrated infrastructure, and its ability to improve earnings and free cash flow through operational efficiencies. The company's positioning has enabled it to fund drilling, manage debt, and return capital to shareholders.
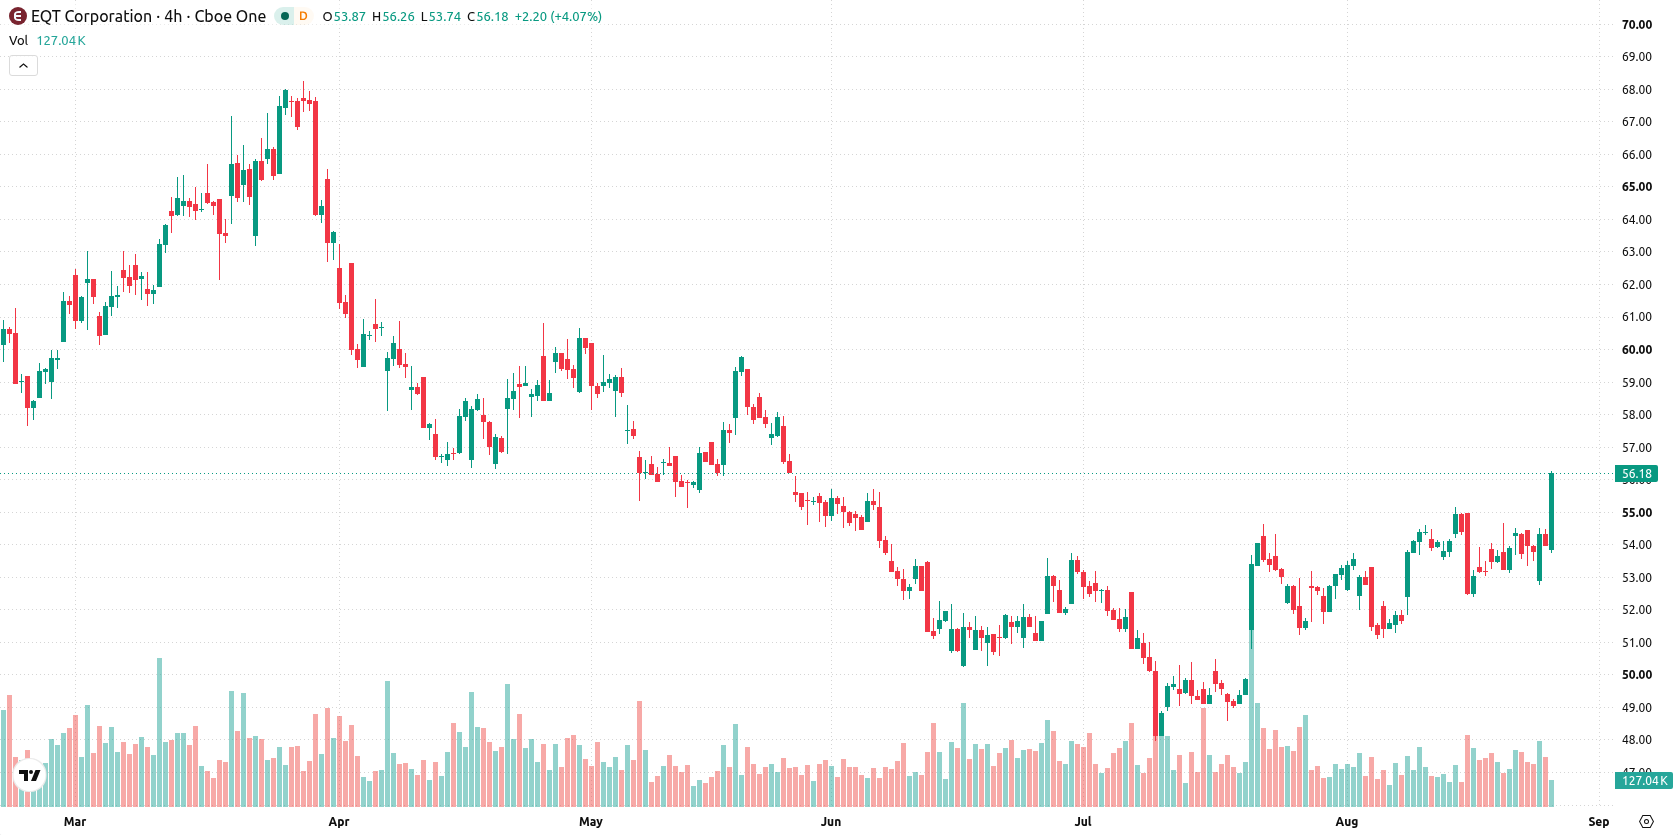
Short-term momentum overshoots as technical resistance tempers longer outlook
EQT is trading above both its 20-day and 50-day moving averages, at $53.28 and $52.07 respectively, but remains marginally below the 200-day at $56.32. This highlights a positive short- and medium-term trend, though the long-term alignment remains bearish; the nearest resistance sits at $56.32, with support at $54.67. Momentum signals present a mixed picture: the Moving Average Convergence Divergence (MACD) and Relative Strength Index (RSI) both indicate a buy, signaling bullish momentum, but the Average Directional Index (ADX) is neutral and Stochastic RSI and Commodity Channel Index (CCI) also flash neutral. Bull/Bear Power (BBP) is strong at 0.99, showing clear buyer dominance and an overbought state. After opening with a downside gap of about $1.05 (-1.94%), the stock has advanced $2.15 (3.98%) to $56.15 and trades near the high of its intraday range, with volatility at 3.69%. The tone is strong toward highs, and momentum generally aligns with the robust daily performance, though the various oscillators suggest potential near-term exhaustion.
Previously it was reported that EQT was facing technical resistance and mixed momentum signals, with expectations for price consolidation and potential pullback. The latest surge, driven by increased institutional investment and reinforced by improving technical signals, suggests that traders should monitor the $56.32 resistance level as a decisive threshold for potential short-term breakout or reversal.






Latest EQT Corporation News




-
 Afghanistan
-
 Albania
-
 Algeria
-
 Angola
-
 Argentina
-
 Armenia
-
 Australia
-
 Austria
-
 Azerbaijan
-
 Bahamas
-
 Bahrain
-
 Bangladesh
-
 Belarus
-
 Belgium
-
 Bolivia
-
 Botswana
-
 Brazil
-
 Brunei
-
 Bulgaria
-
 Cambodia
-
 Cameroon
-
 Canada
-
 Chile
-
 China
-
 Colombia
-
 Congo
-
 Costa Rica
-
 Cote d'Ivoire
-
 Croatia
-
 Cuba
-
 Cyprus
-
 Czechia
-
 DR Congo
-
 Denmark
-
 Dominican Republic
-
 Ecuador
-
 Egypt
-
 El Salvador
-
 Estonia
-
 Eswatini
-
 Ethiopia
-
 Finland
-
 France
-
 Georgia
-
 Germany
-
 Ghana
-
 Greece
-
 Haiti
-
 Hong Kong
-
 Hungary
-
 India
-
 Indonesia
-
 Iran, Islamic republic
-
 Iraq
-
 Ireland
-
 Israel
-
 Italy
-
 Jamaica
-
 Japan
-
 Jordan
-
 Kazakhstan
-
 Kenya
-
 Korea
-
 Kuwait
-
 Kyrgyzstan
-
 Laos
-
 Latvia
-
 Lebanon
-
 Lesotho
-
 Libya
-
 Lithuania
-
 Luxembourg
-
 Madagascar
-
 Malaysia
-
 Malta
-
 Mauritius
-
 Mexico
-
 Moldova
-
 Mongolia
-
 Montenegro
-
 Morocco
-
 Mozambique
-
 Myanmar
-
 Namibia
-
 Nepal
-
 Netherlands
-
 New Zealand
-
 Nigeria
-
 North Macedonia
-
 Norway
-
 Oman
-
 Pakistan
-
 Palestine
-
 Panama
-
 Papua New Guinea
-
 Paraguay
-
 Peru
-
 Philippines
-
 Poland
-
 Portugal
-
 Puerto Rico
-
 Qatar
-
 Reunion
-
 Romania
-
 Rwanda
-
 Saudi Arabia
-
 Serbia
-
 Singapore
-
 Slovakia
-
 Slovenia
-
 Somalia
-
 South Africa
-
 Spain
-
 Sri Lanka
-
 Sweden
-
 Switzerland
-
 Syria
-
 Taiwan
-
 Tajikistan
-
 Tanzania
-
 Thailand
-
 Trinidad and Tobago
-
 Tunisia
-
 Turkey
-
 UAE
-
 Uganda
-
 Ukraine
-
 United Kingdom
-
United States
-
 Uruguay
-
 Uzbekistan
-
 Venezuela
-
 Vietnam
-
 Yemen
-
 Zambia
-
 Zimbabwe
- Forex
- Crypto












