

Reckitt Benckiser shares drop about 1.5% after failing to reclaim key moving averages

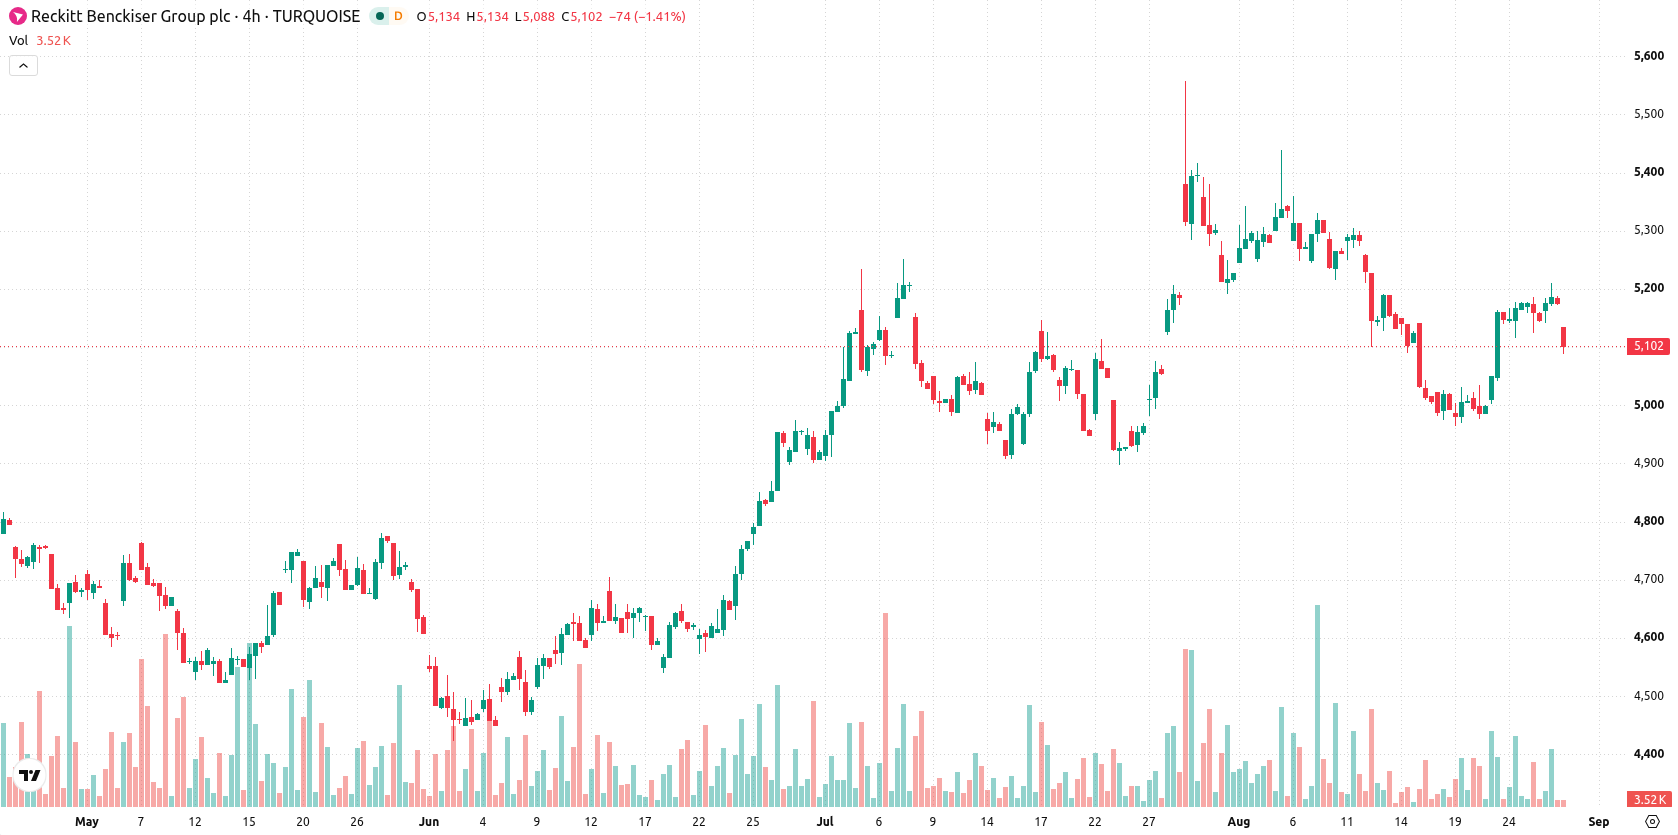
Reckitt Benckiser Group plc (RKT) fell 1.55% today in a move driven by selling pressure, as technical momentum and a lack of fresh catalysts kept the bears in control. The decline is supported by the stock’s failure to reclaim its key short- and long-term moving averages, which signals persistent downward pressure.
 5716.00
5728.00
Highlights
- Shares of Reckitt Benckiser fell 1.55% to GBX5,078, closing near the session low with persistent intraday pressure.
- The stock trades below both 20-day and 200-day moving averages, indicating ongoing long- and short-term selling pressure.
- Technical signals are mixed, but the expected five-day range is GBX4,972 to GBX5,202, with a 79% probability of upward movement.
Mixed momentum as sellers dominate amid weak trend signals
Reckitt Benckiser is trading below its 20-day moving average (GBX5,179) and 200-day moving average (GBX5,412), but remains above the 50-day moving average (GBX5,056). This configuration suggests that short- and long-term sellers are active, with some medium-term support still in place. The nearest resistance level is GBX5,144, while support holds at the 50-day moving average of GBX5,056. The Ichimoku Kijun at GBX5,228 acts as a distant resistance and highlights trend weakness. Momentum signals are mixed: the MACD at 9.14 suggests a strong buy, the RSI at 53.04 also indicates a buy, but the Stochastic RSI (60.25) and CCI (-9.97) are both neutral, while the ADX at 14.38 implies the trend remains weak. Bull/Bear Power (BBP) is high at 83.7, showing buyers are still present, though it is flagged as overbought. Today’s action showed the price dropping to GBX5,078 with volatility remaining elevated.
Earlier, analysts noted that Reckitt Benckiser's outlook was shaped by cost-control measures and mixed technical momentum, calling for close monitoring of support and resistance levels. The latest action reinforces this dynamic, with the technical setup underscoring elevated volatility and making the GBX5,056 support a crucial level for traders to watch in the near term.











-
 Afghanistan
-
 Albania
-
 Algeria
-
 Angola
-
 Argentina
-
 Armenia
-
 Australia
-
 Austria
-
 Azerbaijan
-
 Bahamas
-
 Bahrain
-
 Bangladesh
-
 Belarus
-
 Belgium
-
 Bolivia
-
 Botswana
-
 Brazil
-
 Brunei
-
 Bulgaria
-
 Cambodia
-
 Cameroon
-
 Canada
-
 Chile
-
 China
-
 Colombia
-
 Congo
-
 Costa Rica
-
 Cote d'Ivoire
-
 Croatia
-
 Cuba
-
 Cyprus
-
 Czechia
-
 DR Congo
-
 Denmark
-
 Dominican Republic
-
 Ecuador
-
 Egypt
-
 El Salvador
-
 Estonia
-
 Eswatini
-
 Ethiopia
-
 Finland
-
 France
-
 Georgia
-
 Germany
-
 Ghana
-
 Greece
-
 Haiti
-
 Hong Kong
-
 Hungary
-
 India
-
 Indonesia
-
 Iran, Islamic republic
-
 Iraq
-
 Ireland
-
 Israel
-
 Italy
-
 Jamaica
-
 Japan
-
 Jordan
-
 Kazakhstan
-
 Kenya
-
 Korea
-
 Kuwait
-
 Kyrgyzstan
-
 Laos
-
 Latvia
-
 Lebanon
-
 Lesotho
-
 Libya
-
 Lithuania
-
 Luxembourg
-
 Madagascar
-
 Malaysia
-
 Malta
-
 Mauritius
-
 Mexico
-
 Moldova
-
 Mongolia
-
 Montenegro
-
 Morocco
-
 Mozambique
-
 Myanmar
-
 Namibia
-
 Nepal
-
 Netherlands
-
 New Zealand
-
 Nigeria
-
 North Macedonia
-
 Norway
-
 Oman
-
 Pakistan
-
 Palestine
-
 Panama
-
 Papua New Guinea
-
 Paraguay
-
 Peru
-
 Philippines
-
 Poland
-
 Portugal
-
 Puerto Rico
-
 Qatar
-
 Reunion
-
 Romania
-
 Rwanda
-
 Saudi Arabia
-
 Serbia
-
 Singapore
-
 Slovakia
-
 Slovenia
-
 Somalia
-
 South Africa
-
 Spain
-
 Sri Lanka
-
 Sweden
-
 Switzerland
-
 Syria
-
 Taiwan
-
 Tajikistan
-
 Tanzania
-
 Thailand
-
 Trinidad and Tobago
-
 Tunisia
-
 Turkey
-
 UAE
-
 Uganda
-
 Ukraine
-
 United Kingdom
-
United States
-
 Uruguay
-
 Uzbekistan
-
 Venezuela
-
 Vietnam
-
 Yemen
-
 Zambia
-
 Zimbabwe
- Forex
- Crypto












