

Broadcom shares weekly forecast: Decline stretches into oversold territory as buyers remain sidelined

Shares of Broadcom (AVGO) are trading near $366 as the decline stretches into oversold territory, with price action staying tightly contained over the past week. Heightened corporate risk and cautious sentiment limit conviction from buyers ahead of next week, keeping the focus on support levels and any signals of renewed demand.
 346.14
351.95
Highlights
- Shares of Broadcom edged lower to $366.44 over the week and are trading below key moving averages.
- Bearish momentum persists as the stock remains in a flat trend, with indicators showing oversold conditions and selling pressure.
- Broadcom stock is expected to consolidate between support at $350.07 and resistance at $369.16, with a 77% chance of further decline.
Credit risk and cloud expansion drive sentiment shifts over the week
Broadcom is drawing heightened attention ahead of its September 2, 2026, fiscal Q3 earnings report, as Bloomberg and Yahoo Finance have highlighted growing concerns about the company's exposure to credit risk stemming from expanded off-balance-sheet guarantees and AI chip financing commitments. This has led to a measurable increase in Broadcom's credit default swaps and recent pressure on the stock, according to Bloomberg. Additionally, Yahoo Finance reported that Rackspace Technology has launched a managed cloud platform built on VMware Cloud Foundation 9.1, showcasing further adoption within regulated industries.
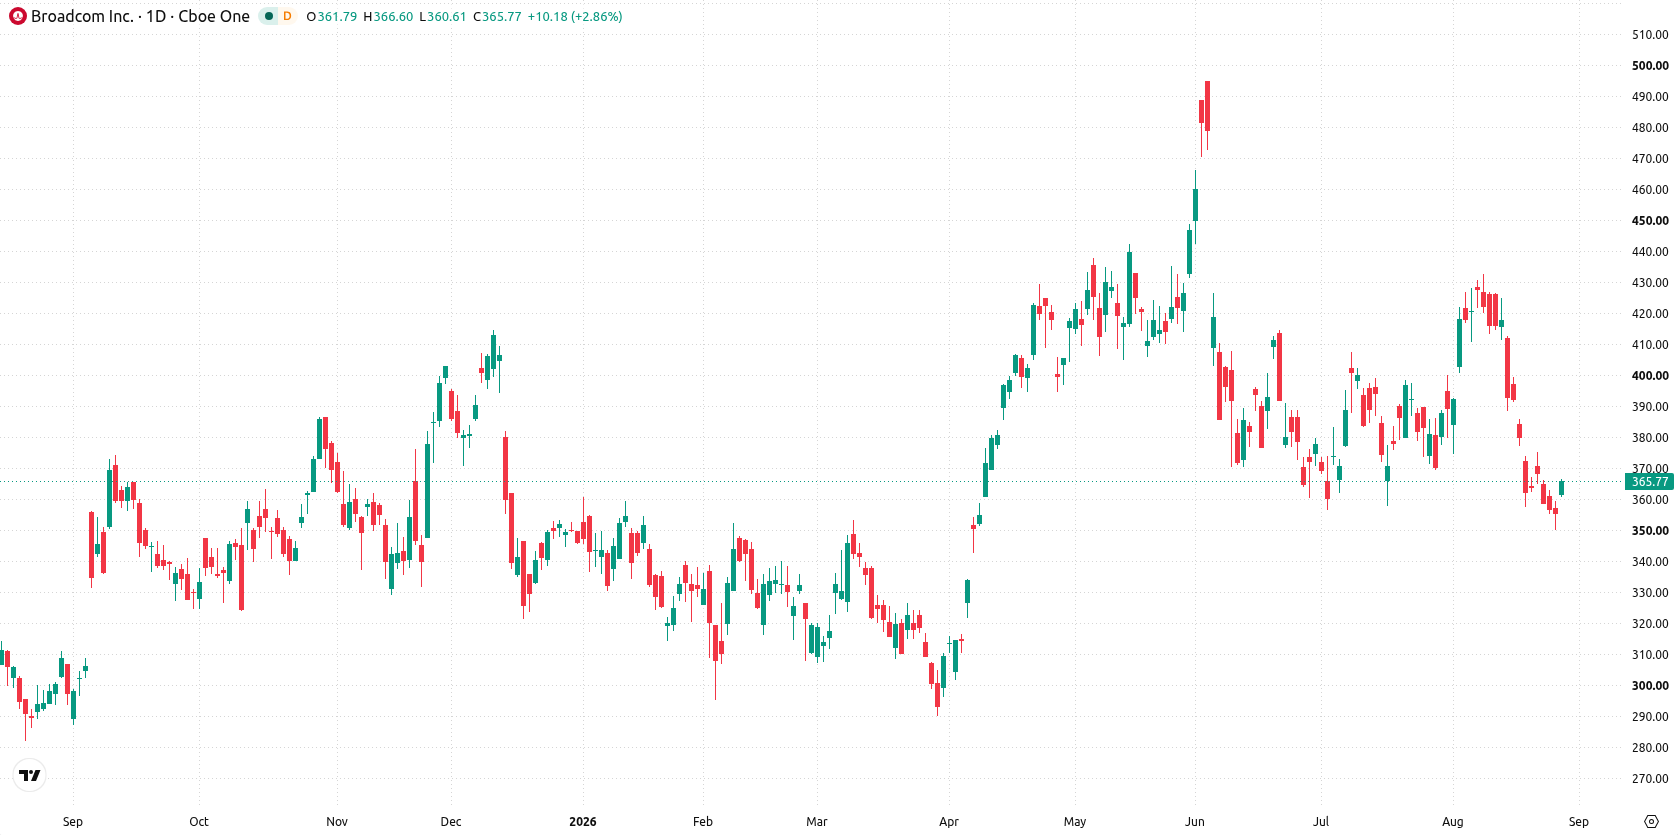
Bearish momentum holds as narrow range and oversold signals persist
On the daily chart, Broadcom stock is showing a flat trend with a contained move within a narrow range, as volatility reached 5.53% in the past seven days. Bearish momentum dominates, with the MACD in sell territory and the Bull/Bear Power indicating an oversold condition at -16.93, while RSI at 34.69 is approaching oversold but not yet extreme. The key support level is at $350.07 and nearest resistance sits at $369.16, with the Ichimoku Kijun at $394.03 acting as additional resistance. The structure implies ongoing pressure, with buyers yet to find footing above the main resistance levels.
Downside bias prevails as support and resistance contain next week’s trade
Next week, the expected trading range is $348.46 to $375.1. The probability of an increase stands at 23%, while a decrease is more likely at 77%. The base case is continued consolidation between support at $350.07 and resistance at $369.16. A move above $369.16 opens the door for a test of $375.1, while a break below $350.07 would risk further downside toward $348.46.
Earlier, analysts noted that Broadcom faced ongoing downside risk due to technical weakness, with any potential shift hinging on buyers overcoming critical resistance. With recent developments highlighting increased corporate credit risk and new sector partnerships, traders should closely monitor the $350.07 support and $369.16 resistance, as a decisive break from this range may signal the next directional move.









-
 Afghanistan
-
 Albania
-
 Algeria
-
 Angola
-
 Argentina
-
 Armenia
-
 Australia
-
 Austria
-
 Azerbaijan
-
 Bahamas
-
 Bahrain
-
 Bangladesh
-
 Belarus
-
 Belgium
-
 Bolivia
-
 Botswana
-
 Brazil
-
 Brunei
-
 Bulgaria
-
 Cambodia
-
 Cameroon
-
 Canada
-
 Chile
-
 China
-
 Colombia
-
 Congo
-
 Costa Rica
-
 Cote d'Ivoire
-
 Croatia
-
 Cuba
-
 Cyprus
-
 Czechia
-
 DR Congo
-
 Denmark
-
 Dominican Republic
-
 Ecuador
-
 Egypt
-
 El Salvador
-
 Estonia
-
 Eswatini
-
 Ethiopia
-
 Finland
-
 France
-
 Georgia
-
 Germany
-
 Ghana
-
 Greece
-
 Haiti
-
 Hong Kong
-
 Hungary
-
 India
-
 Indonesia
-
 Iran, Islamic republic
-
 Iraq
-
 Ireland
-
 Israel
-
 Italy
-
 Jamaica
-
 Japan
-
 Jordan
-
 Kazakhstan
-
 Kenya
-
 Korea
-
 Kuwait
-
 Kyrgyzstan
-
 Laos
-
 Latvia
-
 Lebanon
-
 Lesotho
-
 Libya
-
 Lithuania
-
 Luxembourg
-
 Madagascar
-
 Malaysia
-
 Malta
-
 Mauritius
-
 Mexico
-
 Moldova
-
 Mongolia
-
 Montenegro
-
 Morocco
-
 Mozambique
-
 Myanmar
-
 Namibia
-
 Nepal
-
 Netherlands
-
 New Zealand
-
 Nigeria
-
 North Macedonia
-
 Norway
-
 Oman
-
 Pakistan
-
 Palestine
-
 Panama
-
 Papua New Guinea
-
 Paraguay
-
 Peru
-
 Philippines
-
 Poland
-
 Portugal
-
 Puerto Rico
-
 Qatar
-
 Reunion
-
 Romania
-
 Rwanda
-
 Saudi Arabia
-
 Serbia
-
 Singapore
-
 Slovakia
-
 Slovenia
-
 Somalia
-
 South Africa
-
 Spain
-
 Sri Lanka
-
 Sweden
-
 Switzerland
-
 Syria
-
 Taiwan
-
 Tajikistan
-
 Tanzania
-
 Thailand
-
 Trinidad and Tobago
-
 Tunisia
-
 Turkey
-
 UAE
-
 Uganda
-
 Ukraine
-
 United Kingdom
-
United States
-
 Uruguay
-
 Uzbekistan
-
 Venezuela
-
 Vietnam
-
 Yemen
-
 Zambia
-
 Zimbabwe
- Forex
- Crypto












