

AbbVie stock weekly forecast: support at $254.34 under scrutiny as sellers press recent lows

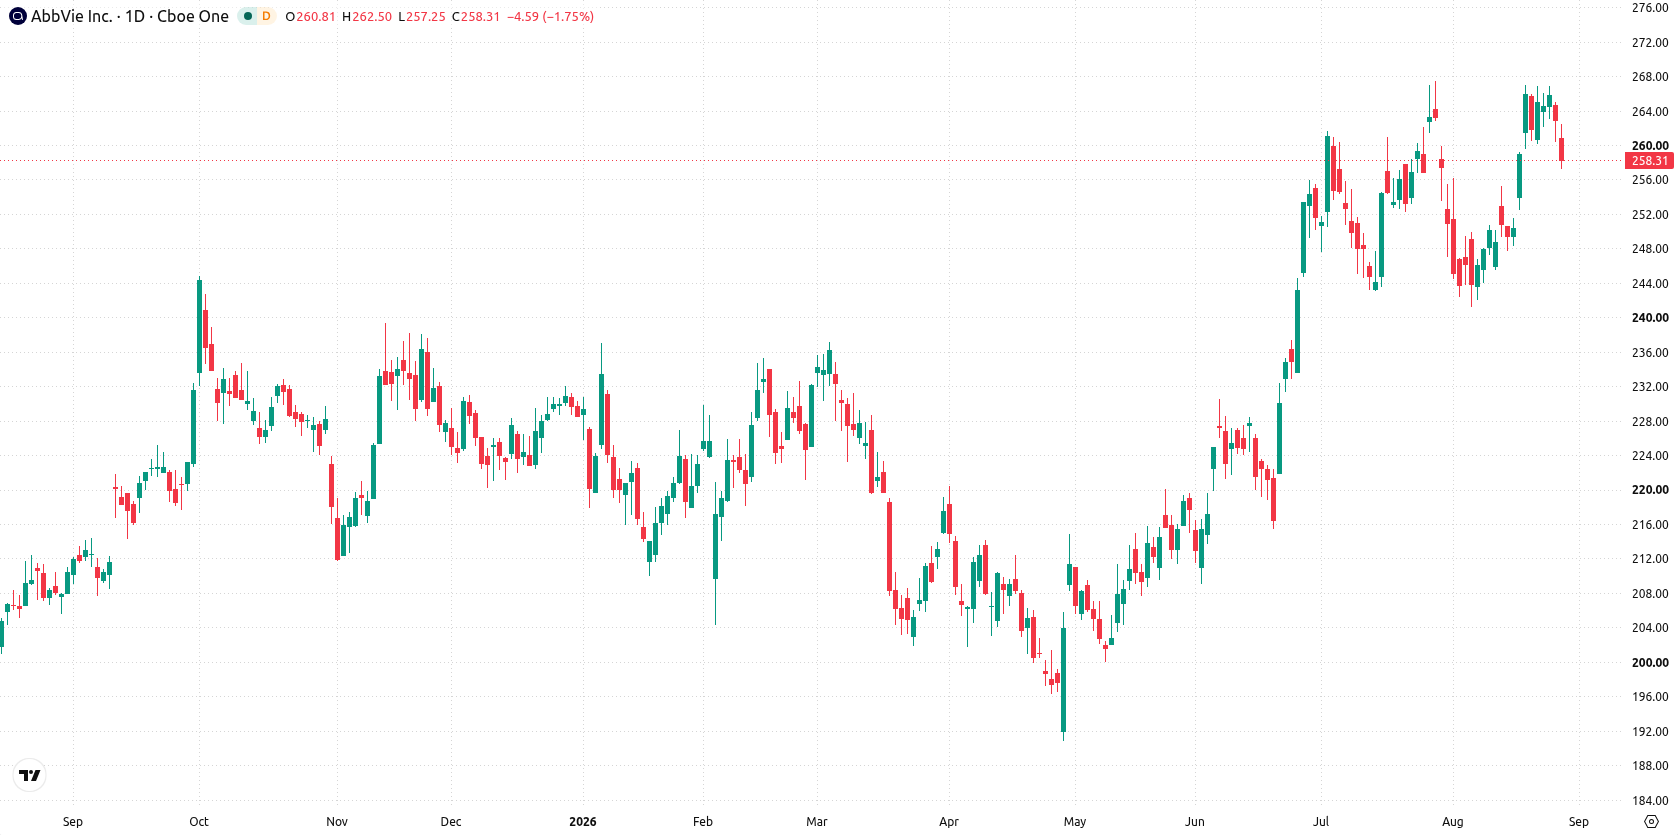
Shares of AbbVie Inc. (ABBV) are trading near $259 after slipping nearly 3% over the past week, as recovery attempts hold but look stretched. Corporate updates and recent product data have set the tone for the coming sessions — the focus now shifts to whether this support can withstand further volatility.
 294.56
302.68
Highlights
- Shares of AbbVie declined 2.56% over the past 7 days to $258.54, trending at the low edge of their recent range.
- Technical indicators send mixed signals with a buy from MACD, overbought signals from Bull/Bear Power, and a sell from HMA.
- Next week, AbbVie stock is forecast to consolidate between $253.23 and $265.05, with a 77% probability of an increase if resistance at $260.31 is broken.
Guidance boosts outlook as new product growth offsets legacy declines
ABBV reported strong second-quarter 2026 earnings, with revenue rising 10.2% to $16.99 billion and adjusted diluted EPS up 22.9% to $3.65, as reported by www.ad-hoc-news.de and confirmed by Seeking Alpha and Yahoo Finance. Growth from Skyrizi and Rinvoq offset a sharp drop in Humira sales, supporting sentiment for the upcoming week. The company lifted its full-year 2026 EPS guidance and maintained a $1.73 quarterly dividend, while releasing new clinical data for investigational lung cancer therapies at the 2026 World Conference on Lung Cancer, according to PR Newswire.
Mixed technical signals deepen as price tests key weekly boundaries
On the daily chart, the backdrop is a developing trend with volatility at 2.53%, as the stock has moved sharply to the lower edge of its recent range. While the MACD gives a buy forecast and Bull/Bear Power signals overbought conditions, HMA issues a sell call, indicating a lack of full momentum confirmation. $254.34, the Ichimoku Kijun level, now marks the nearest support, while resistance sits at $260.31. This mix of signals and the current momentum character—a developing, unconfirmed move lower—suggests that a clearer direction could emerge with a break of either boundary.
Trend confirmation hinges on resistance breakout or support breach next week
Next week, AbbVie stock is expected to trade between $253.23 and $265.05. The probability of an increase stands at 77%, versus a 23% chance of a decrease. The base case is consolidation within this range, with the trend’s confirmation hinging on a break of $260.31 to the upside or $254.34 to the downside. Above resistance, further gains may follow, while a dip below support would tilt the near-term risk lower.
Earlier, analysts noted that AbbVie's technical momentum and regulatory advancements positioned the stock for potential further gains. The recent mix of strong earnings and product updates now introduces additional catalysts, with a conclusive directional move likely to be confirmed by a break above $260.31 resistance or below $254.34 support.











-
 Afghanistan
-
 Albania
-
 Algeria
-
 Angola
-
 Argentina
-
 Armenia
-
 Australia
-
 Austria
-
 Azerbaijan
-
 Bahamas
-
 Bahrain
-
 Bangladesh
-
 Belarus
-
 Belgium
-
 Bolivia
-
 Botswana
-
 Brazil
-
 Brunei
-
 Bulgaria
-
 Cambodia
-
 Cameroon
-
 Canada
-
 Chile
-
 China
-
 Colombia
-
 Congo
-
 Costa Rica
-
 Cote d'Ivoire
-
 Croatia
-
 Cuba
-
 Cyprus
-
 Czechia
-
 DR Congo
-
 Denmark
-
 Dominican Republic
-
 Ecuador
-
 Egypt
-
 El Salvador
-
 Estonia
-
 Eswatini
-
 Ethiopia
-
 Finland
-
 France
-
 Georgia
-
 Germany
-
 Ghana
-
 Greece
-
 Haiti
-
 Hong Kong
-
 Hungary
-
 India
-
 Indonesia
-
 Iran, Islamic republic
-
 Iraq
-
 Ireland
-
 Israel
-
 Italy
-
 Jamaica
-
 Japan
-
 Jordan
-
 Kazakhstan
-
 Kenya
-
 Korea
-
 Kuwait
-
 Kyrgyzstan
-
 Laos
-
 Latvia
-
 Lebanon
-
 Lesotho
-
 Libya
-
 Lithuania
-
 Luxembourg
-
 Madagascar
-
 Malaysia
-
 Malta
-
 Mauritius
-
 Mexico
-
 Moldova
-
 Mongolia
-
 Montenegro
-
 Morocco
-
 Mozambique
-
 Myanmar
-
 Namibia
-
 Nepal
-
 Netherlands
-
 New Zealand
-
 Nigeria
-
 North Macedonia
-
 Norway
-
 Oman
-
 Pakistan
-
 Palestine
-
 Panama
-
 Papua New Guinea
-
 Paraguay
-
 Peru
-
 Philippines
-
 Poland
-
 Portugal
-
 Puerto Rico
-
 Qatar
-
 Reunion
-
 Romania
-
 Rwanda
-
 Saudi Arabia
-
 Serbia
-
 Singapore
-
 Slovakia
-
 Slovenia
-
 Somalia
-
 South Africa
-
 Spain
-
 Sri Lanka
-
 Sweden
-
 Switzerland
-
 Syria
-
 Taiwan
-
 Tajikistan
-
 Tanzania
-
 Thailand
-
 Trinidad and Tobago
-
 Tunisia
-
 Turkey
-
 UAE
-
 Uganda
-
 Ukraine
-
 United Kingdom
-
United States
-
 Uruguay
-
 Uzbekistan
-
 Venezuela
-
 Vietnam
-
 Yemen
-
 Zambia
-
 Zimbabwe
- Forex
- Crypto












