

Rebound amid resistance test: Can Bit Digital stock extend gains?

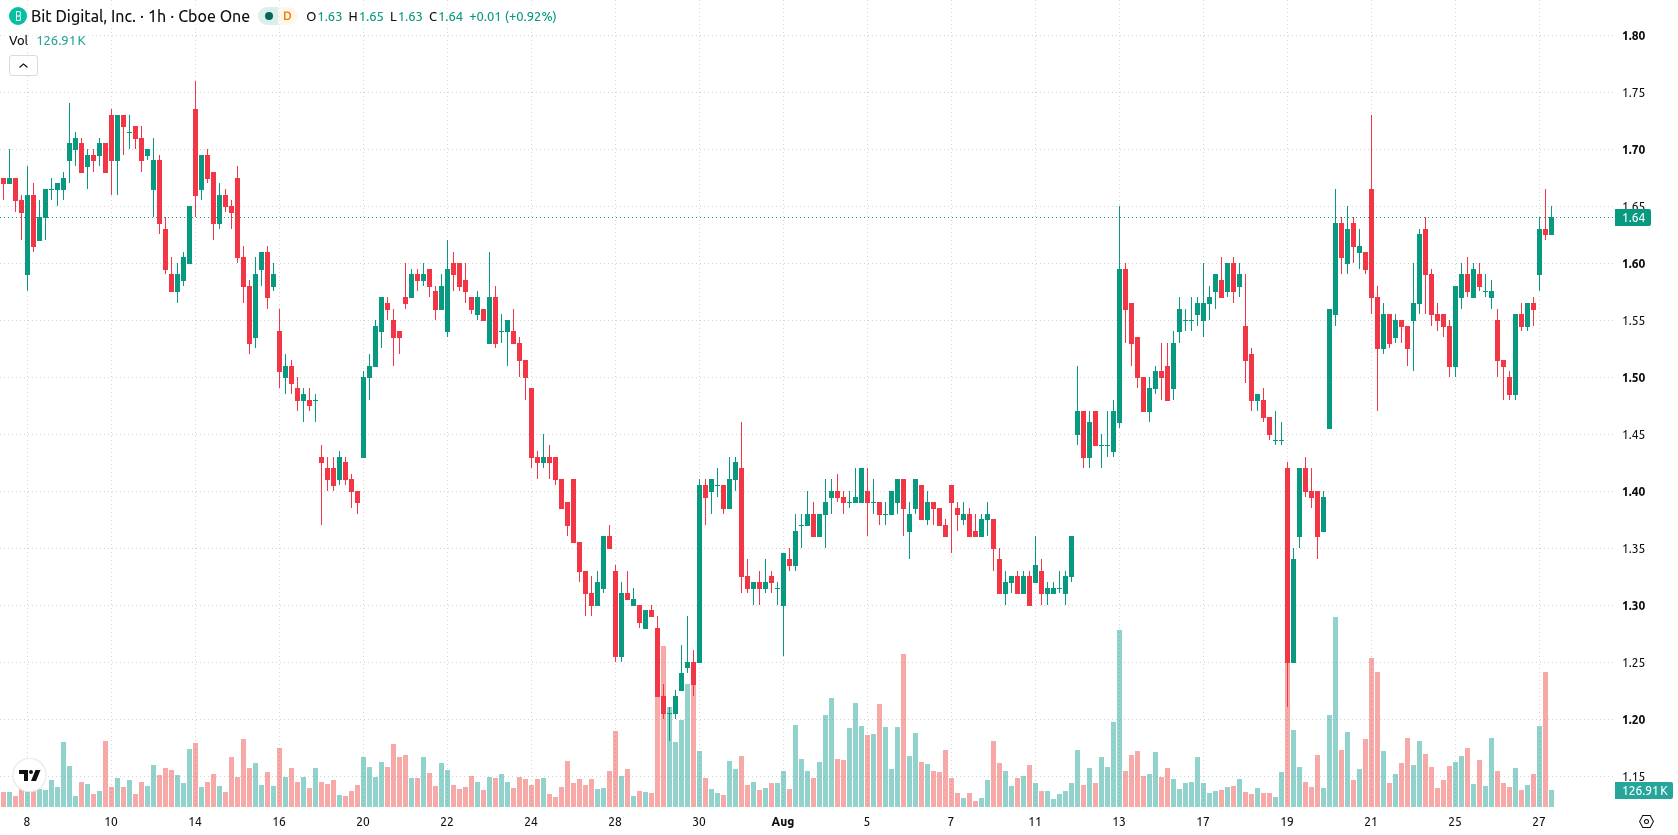
Bit Digital (BTBT) stock is trading at $1.62 after closing 3.85% higher on the day. Shares finished the session above their key short- and medium-term moving averages but remain below longer-term averages.
 0.7593
0.8749
Highlights
- BTBT trades above key short- and medium-term moving averages but remains below its long-term average, showing mixed trend signals.
- MACD indicates strong buy momentum, but neutral oscillator readings create uncertainty in short-term direction.
- Expected trading range for the next few days is $1.5 to $1.74 with a high likelihood of upward movement unless price drops below $1.5 support.
Momentum divergence and range trade as technical signals conflict
BTBT is trading above the MA-20 at $1.56 and the MA-50 at $1.53 on the hourly chart, while remaining below the MA-200 at $1.83 on the daily timeframe. The Ichimoku Kijun level at $1.56 acts as immediate support. MACD signals a strong buy and is aligned with constructive intraday price action, but ADX remains neutral, reflecting the absence of a dominant trend. RSI is at 51.32, suggesting a mild buyer advantage; both CCI and Stoch RSI read neutral, and Bull/Bear Power indicates strong buyer dominance intraday. A gap of $0.03 to the downside exists from the previous close, and price action occurred near today's session high in a volatile context. There is divergence between strong momentum and neutral oscillator readings, creating a mixed technical backdrop.
Bias tilts upward as price consolidates within volatile band
For the next few sessions, BTBT is expected to trade within a short-term range of $1.5 to $1.74, reflecting typical volatility for the asset. A sideways scenario is most likely, as the price consolidates within this band. Should the price break above $1.74, a bullish move could accelerate, while a drop below $1.5 would signal a bearish turn. The probability favors an upward scenario, with downside moves considered much less likely in the immediate term.
Earlier, analysts noted that Bit Digital was trading under persistent selling pressure despite improving fundamentals and mixed technical signals. The latest technical alignment now signals a potential bullish shift, with the current trading range between $1.5 and $1.74 offering a key zone to monitor for breakout or reversal risk in the sessions ahead.






Latest Bit Digital News



-
 Afghanistan
-
 Albania
-
 Algeria
-
 Angola
-
 Argentina
-
 Armenia
-
 Australia
-
 Austria
-
 Azerbaijan
-
 Bahamas
-
 Bahrain
-
 Bangladesh
-
 Belarus
-
 Belgium
-
 Bolivia
-
 Botswana
-
 Brazil
-
 Brunei
-
 Bulgaria
-
 Cambodia
-
 Cameroon
-
 Canada
-
 Chile
-
 China
-
 Colombia
-
 Congo
-
 Costa Rica
-
 Cote d'Ivoire
-
 Croatia
-
 Cuba
-
 Cyprus
-
 Czechia
-
 DR Congo
-
 Denmark
-
 Dominican Republic
-
 Ecuador
-
 Egypt
-
 El Salvador
-
 Estonia
-
 Eswatini
-
 Ethiopia
-
 Finland
-
 France
-
 Georgia
-
 Germany
-
 Ghana
-
 Greece
-
 Haiti
-
 Hong Kong
-
 Hungary
-
 India
-
 Indonesia
-
 Iran, Islamic republic
-
 Iraq
-
 Ireland
-
 Israel
-
 Italy
-
 Jamaica
-
 Japan
-
 Jordan
-
 Kazakhstan
-
 Kenya
-
 Korea
-
 Kuwait
-
 Kyrgyzstan
-
 Laos
-
 Latvia
-
 Lebanon
-
 Lesotho
-
 Libya
-
 Lithuania
-
 Luxembourg
-
 Madagascar
-
 Malaysia
-
 Malta
-
 Mauritius
-
 Mexico
-
 Moldova
-
 Mongolia
-
 Montenegro
-
 Morocco
-
 Mozambique
-
 Myanmar
-
 Namibia
-
 Nepal
-
 Netherlands
-
 New Zealand
-
 Nigeria
-
 North Macedonia
-
 Norway
-
 Oman
-
 Pakistan
-
 Palestine
-
 Panama
-
 Papua New Guinea
-
 Paraguay
-
 Peru
-
 Philippines
-
 Poland
-
 Portugal
-
 Puerto Rico
-
 Qatar
-
 Reunion
-
 Romania
-
 Rwanda
-
 Saudi Arabia
-
 Serbia
-
 Singapore
-
 Slovakia
-
 Slovenia
-
 Somalia
-
 South Africa
-
 Spain
-
 Sri Lanka
-
 Sweden
-
 Switzerland
-
 Syria
-
 Taiwan
-
 Tajikistan
-
 Tanzania
-
 Thailand
-
 Trinidad and Tobago
-
 Tunisia
-
 Turkey
-
 UAE
-
 Uganda
-
 Ukraine
-
 United Kingdom
-
United States
-
 Uruguay
-
 Uzbekistan
-
 Venezuela
-
 Vietnam
-
 Yemen
-
 Zambia
-
 Zimbabwe
- Forex
- Crypto












