

What's behind Workday's latest 3.0% stock pullback?

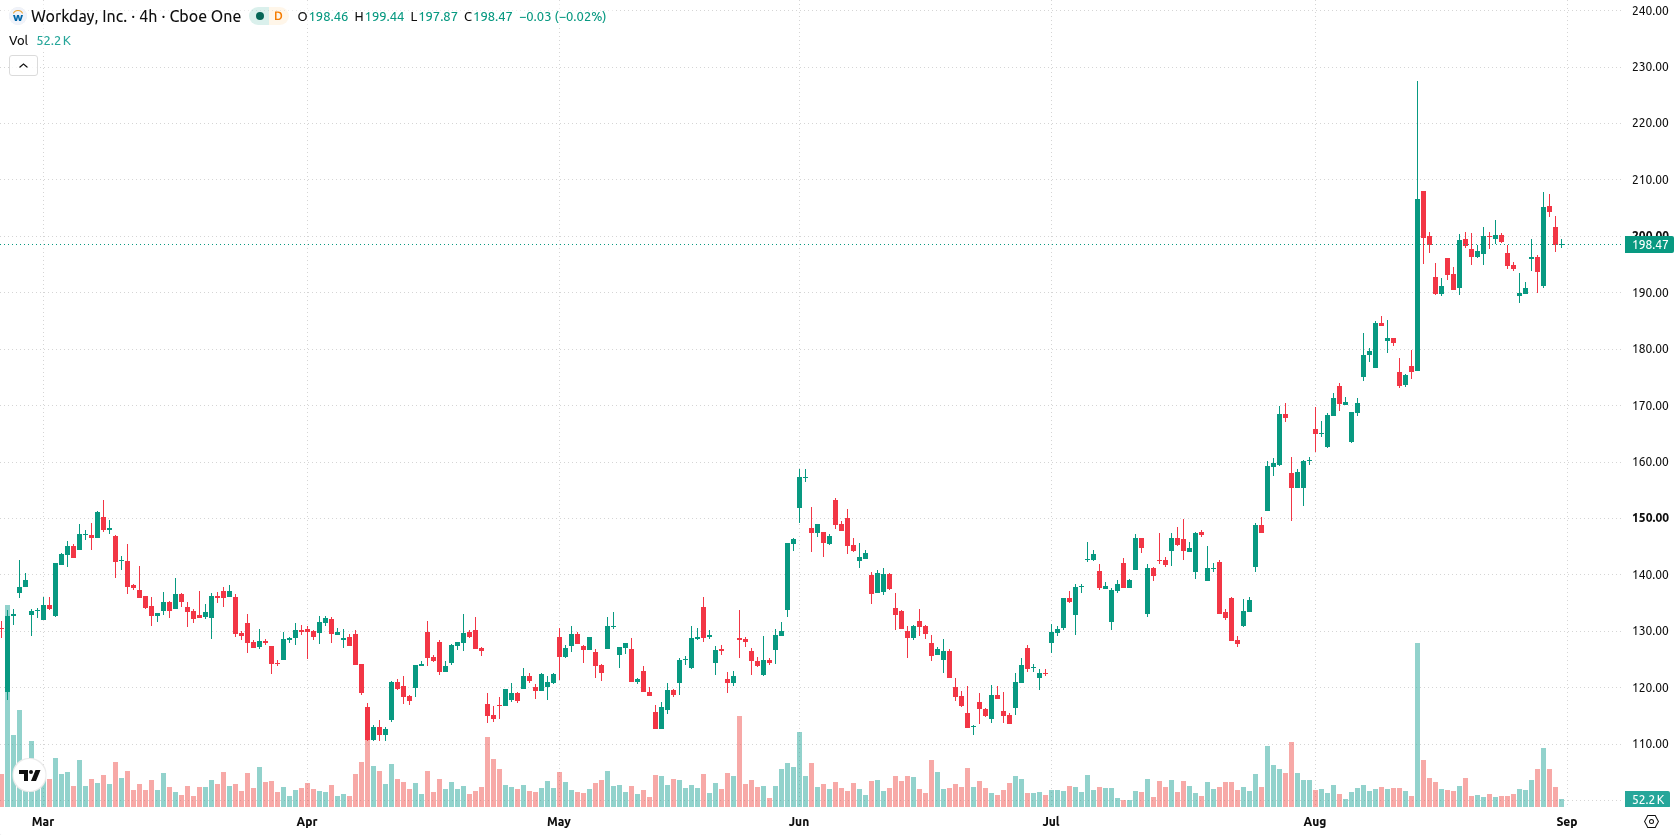
Workday Inc (WDAY) dropped 2.97% after a strong quarterly earnings report highlighted rising AI-driven contract value and a sizable new share repurchase program, even as price action showed immediate selling pressure following the open. This move contradicts the otherwise bullish technical structure, with the stock still trading above its short- and medium-term moving averages and near notable support levels.
 196.66
Highlights
- Workday reported 13% year-over-year revenue growth for its second fiscal quarter and attributed over $600 million in annual revenue to AI-driven agents.
- The board approved a $4 billion open-ended share repurchase and the company ended the quarter with $3.4 billion in cash and marketable securities.
- Shares of Workday last traded at $198.26, down 2.97%, with technicals indicating overbought conditions, support at $197.1, resistance at $203.64, and an expected range of $189.13 to $207.39.
Investor sentiment diverges as AI revenue jumps and buyback expands
Workday Inc reported second-quarter fiscal 2027 results, posting 13% year-over-year revenue growth. The company announced that artificial intelligence-driven agents contributed over $600 million in annual revenue and over $100 million in new contract value during the period, with more than 170 customers purchasing new adaptive decision intelligence products. The board approved a $4 billion open-ended share repurchase program, and Workday ended the quarter with $3.4 billion in cash and marketable securities, though price action has remained under broader selling pressure.
Momentum signals remain bullish despite overbought risks and mixed trends
Workday is trading above its 20-day, 50-day, and 200-day moving averages ($188.18, $157.35, and $160.85), indicating a bullish outlook for both short- and medium-term trends, while the alignment of the 50- and 200-day moving averages remains bearish for the longer-term structure. Key support lies at $197.1 and resistance is at $203.64, with the Ichimoku Kijun at $179.03 supporting the broader trend. Momentum indicators are robust, as MACD, ADX, RSI, and CCI all generate buy signals, but CCI and RSI are near overbought territory. Bull/Bear Power (BBP) of 15.2 confirms buyers control intraday momentum and also warns of overbought conditions. The Awesome Oscillator and Stochastic RSI (43.95) remain neutral. The stock last traded at $198.26, closing near the day’s low after an opening downside gap, with intraday volatility at 3.32% and short-term momentum tracking the observed weakness.
Earlier, analysts noted that Workday maintained a broadly bullish technical structure, supported by strong momentum but showing caution around potential overbought conditions. The current price action underscores that, while the bullish outlook remains intact above key support, any sustained break below $197.1 could introduce heightened downside risk for short-term traders.






Latest Workday News




-
 Afghanistan
-
 Albania
-
 Algeria
-
 Angola
-
 Argentina
-
 Armenia
-
 Australia
-
 Austria
-
 Azerbaijan
-
 Bahamas
-
 Bahrain
-
 Bangladesh
-
 Belarus
-
 Belgium
-
 Bolivia
-
 Botswana
-
 Brazil
-
 Brunei
-
 Bulgaria
-
 Cambodia
-
 Cameroon
-
 Canada
-
 Chile
-
 China
-
 Colombia
-
 Congo
-
 Costa Rica
-
 Cote d'Ivoire
-
 Croatia
-
 Cuba
-
 Cyprus
-
 Czechia
-
 DR Congo
-
 Denmark
-
 Dominican Republic
-
 Ecuador
-
 Egypt
-
 El Salvador
-
 Estonia
-
 Eswatini
-
 Ethiopia
-
 Finland
-
 France
-
 Georgia
-
 Germany
-
 Ghana
-
 Greece
-
 Haiti
-
 Hong Kong
-
 Hungary
-
 India
-
 Indonesia
-
 Iran, Islamic republic
-
 Iraq
-
 Ireland
-
 Israel
-
 Italy
-
 Jamaica
-
 Japan
-
 Jordan
-
 Kazakhstan
-
 Kenya
-
 Korea
-
 Kuwait
-
 Kyrgyzstan
-
 Laos
-
 Latvia
-
 Lebanon
-
 Lesotho
-
 Libya
-
 Lithuania
-
 Luxembourg
-
 Madagascar
-
 Malaysia
-
 Malta
-
 Mauritius
-
 Mexico
-
 Moldova
-
 Mongolia
-
 Montenegro
-
 Morocco
-
 Mozambique
-
 Myanmar
-
 Namibia
-
 Nepal
-
 Netherlands
-
 New Zealand
-
 Nigeria
-
 North Macedonia
-
 Norway
-
 Oman
-
 Pakistan
-
 Palestine
-
 Panama
-
 Papua New Guinea
-
 Paraguay
-
 Peru
-
 Philippines
-
 Poland
-
 Portugal
-
 Puerto Rico
-
 Qatar
-
 Reunion
-
 Romania
-
 Rwanda
-
 Saudi Arabia
-
 Serbia
-
 Singapore
-
 Slovakia
-
 Slovenia
-
 Somalia
-
 South Africa
-
 Spain
-
 Sri Lanka
-
 Sweden
-
 Switzerland
-
 Syria
-
 Taiwan
-
 Tajikistan
-
 Tanzania
-
 Thailand
-
 Trinidad and Tobago
-
 Tunisia
-
 Turkey
-
 UAE
-
 Uganda
-
 Ukraine
-
 United Kingdom
-
United States
-
 Uruguay
-
 Uzbekistan
-
 Venezuela
-
 Vietnam
-
 Yemen
-
 Zambia
-
 Zimbabwe
- Forex
- Crypto












