

Can Agnico Eagle Mines stock avoid deeper losses as support pressure builds?

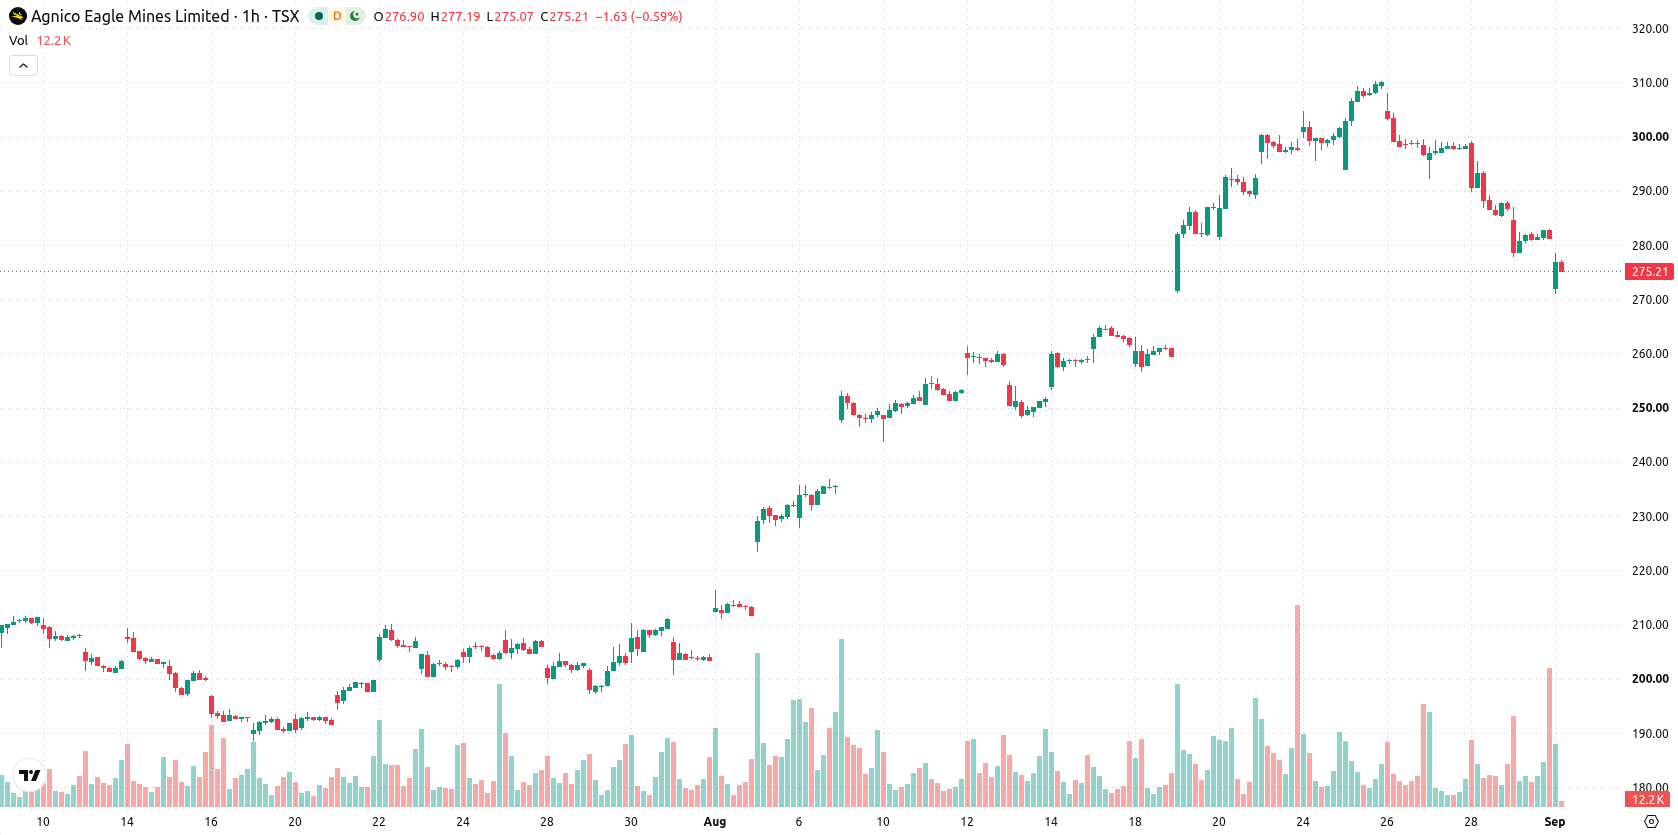
Agnico Eagle Mines (AEM) stock is trading at C$274.7 after falling 2.43% on the day. The shares are currently positioned below their key short- and medium-term moving averages, while remaining above the longer-term average.
 257.49
285.34
Highlights
- Empowered Funds LLC and Corient Private Wealth LP each acquired over 43,000 shares of Agnico Eagle Mines, raising institutional ownership in the stock.
- These large institutional purchases came during a period of continued selling pressure affecting Agnico Eagle Mines shares.
- Agnico Eagle Mines stock trades below key moving averages with technicals signaling short- and medium-term bearishness and a projected price range of C$261.27 to C$288.13.
Institutional buying increases liquidity as selling persists
Empowered Funds LLC acquired a new stake of 43,472 shares in Agnico Eagle Mines Limited during the second quarter, increasing institutional ownership in the stock, as reported by Americanbankingnews. This move has the potential to enhance underlying liquidity and affect trading sensitivity to larger block transactions. Corient Private Wealth LP's purchase of 45,899 shares in the same period further adds to institutional presence and could shape demand dynamics. These increases in institutional holdings have occurred as price action has remained under broader selling pressure.
Bearish momentum builds as price tests oversold signals
On the hourly chart, AEM is trading below its MA-20 at C$288.68 and MA-50 at C$295.98, but stays above its MA-200 at C$257.45. Immediate resistance is identified at the Ichimoku Kijun level of C$289.03, with the next notable support at C$261.27. Momentum signals remain negative, with MACD and ADX indicating a bearish setup. RSI is at 33.16 and CCI continues to point to oversold conditions, while Stoch RSI is neutral. Bull/Bear Power reflects ongoing seller dominance, indicating renewed downside pressure intraday, while the Awesome Oscillator is neutral.
Sideways action expected as downside risk dominates
In the short term, the expected price range for AEM is C$261.27 to C$288.13, defining a volatility band relative to current levels. Based on prevailing technical signals, the probability of a down move stands at 77%, while the chance of an up move is seen at 23%. The base scenario anticipates the stock trading sideways within this range. A break above resistance at C$289.03 would introduce a bullish scenario, while a sustained decline through the C$261.27 support could extend downside momentum.
Earlier, analysts noted that Agnico Eagle Mines was maintaining a bullish trend supported by longer-term technicals, despite indications of short-term momentum weakness. The current picture underscores a shift to near-term bearish momentum and increased institutional activity, making the C$289.03 resistance and C$261.27 support critical levels to monitor for potential breakout or further downside continuation.










-
 Afghanistan
-
 Albania
-
 Algeria
-
 Angola
-
 Argentina
-
 Armenia
-
 Australia
-
 Austria
-
 Azerbaijan
-
 Bahamas
-
 Bahrain
-
 Bangladesh
-
 Belarus
-
 Belgium
-
 Bolivia
-
 Botswana
-
 Brazil
-
 Brunei
-
 Bulgaria
-
 Cambodia
-
 Cameroon
-
 Canada
-
 Chile
-
 China
-
 Colombia
-
 Congo
-
 Costa Rica
-
 Cote d'Ivoire
-
 Croatia
-
 Cuba
-
 Cyprus
-
 Czechia
-
 DR Congo
-
 Denmark
-
 Dominican Republic
-
 Ecuador
-
 Egypt
-
 El Salvador
-
 Estonia
-
 Eswatini
-
 Ethiopia
-
 Finland
-
 France
-
 Georgia
-
 Germany
-
 Ghana
-
 Greece
-
 Haiti
-
 Hong Kong
-
 Hungary
-
 India
-
 Indonesia
-
 Iran, Islamic republic
-
 Iraq
-
 Ireland
-
 Israel
-
 Italy
-
 Jamaica
-
 Japan
-
 Jordan
-
 Kazakhstan
-
 Kenya
-
 Korea
-
 Kuwait
-
 Kyrgyzstan
-
 Laos
-
 Latvia
-
 Lebanon
-
 Lesotho
-
 Libya
-
 Lithuania
-
 Luxembourg
-
 Madagascar
-
 Malaysia
-
 Malta
-
 Mauritius
-
 Mexico
-
 Moldova
-
 Mongolia
-
 Montenegro
-
 Morocco
-
 Mozambique
-
 Myanmar
-
 Namibia
-
 Nepal
-
 Netherlands
-
 New Zealand
-
 Nigeria
-
 North Macedonia
-
 Norway
-
 Oman
-
 Pakistan
-
 Palestine
-
 Panama
-
 Papua New Guinea
-
 Paraguay
-
 Peru
-
 Philippines
-
 Poland
-
 Portugal
-
 Puerto Rico
-
 Qatar
-
 Reunion
-
 Romania
-
 Rwanda
-
 Saudi Arabia
-
 Serbia
-
 Singapore
-
 Slovakia
-
 Slovenia
-
 Somalia
-
 South Africa
-
 Spain
-
 Sri Lanka
-
 Sweden
-
 Switzerland
-
 Syria
-
 Taiwan
-
 Tajikistan
-
 Tanzania
-
 Thailand
-
 Trinidad and Tobago
-
 Tunisia
-
 Turkey
-
 UAE
-
 Uganda
-
 Ukraine
-
 United Kingdom
-
United States
-
 Uruguay
-
 Uzbekistan
-
 Venezuela
-
 Vietnam
-
 Yemen
-
 Zambia
-
 Zimbabwe
- Forex
- Crypto












