

UiPath stock outlook: Overbought conditions raise risk of reversal setup

UiPath Inc. (PATH) stock is trading at $18.05 after falling 3.35% for the session. Shares are currently below their key short-term moving average, but continue to hold above major medium- and long-term averages.
 13.32
14.02
Highlights
- UiPath stock is set for an earnings release on September 3, focusing investor attention on updated performance measures and outlook.
- The Maestro Case AI-native case management solution is now available, expanding UiPath's automation capabilities for complex process treatment.
- UiPath stock trades under short-term selling pressure but retains a medium- to long-term bullish technical setup, with price expected to range between $16.9 and $19.2 in coming sessions.
Portfolio positioning shifts expected as investors await earnings and new product impact
UiPath Inc. is set to release its earnings on September 3, a scheduled event that often brings heightened investor attention to potential changes in company performance measures. This anticipation can prompt adjustments in portfolio positioning as market participants await clarity on operational results and outlook. In other developments, the launch of Maestro Case—a new AI-native case management solution designed for complex process treatment—was reported by Investing.com, and adds to PATH’s automation offerings. These corporate actions have been noted as key context for recent trading, though price action has remained under broader selling pressure.
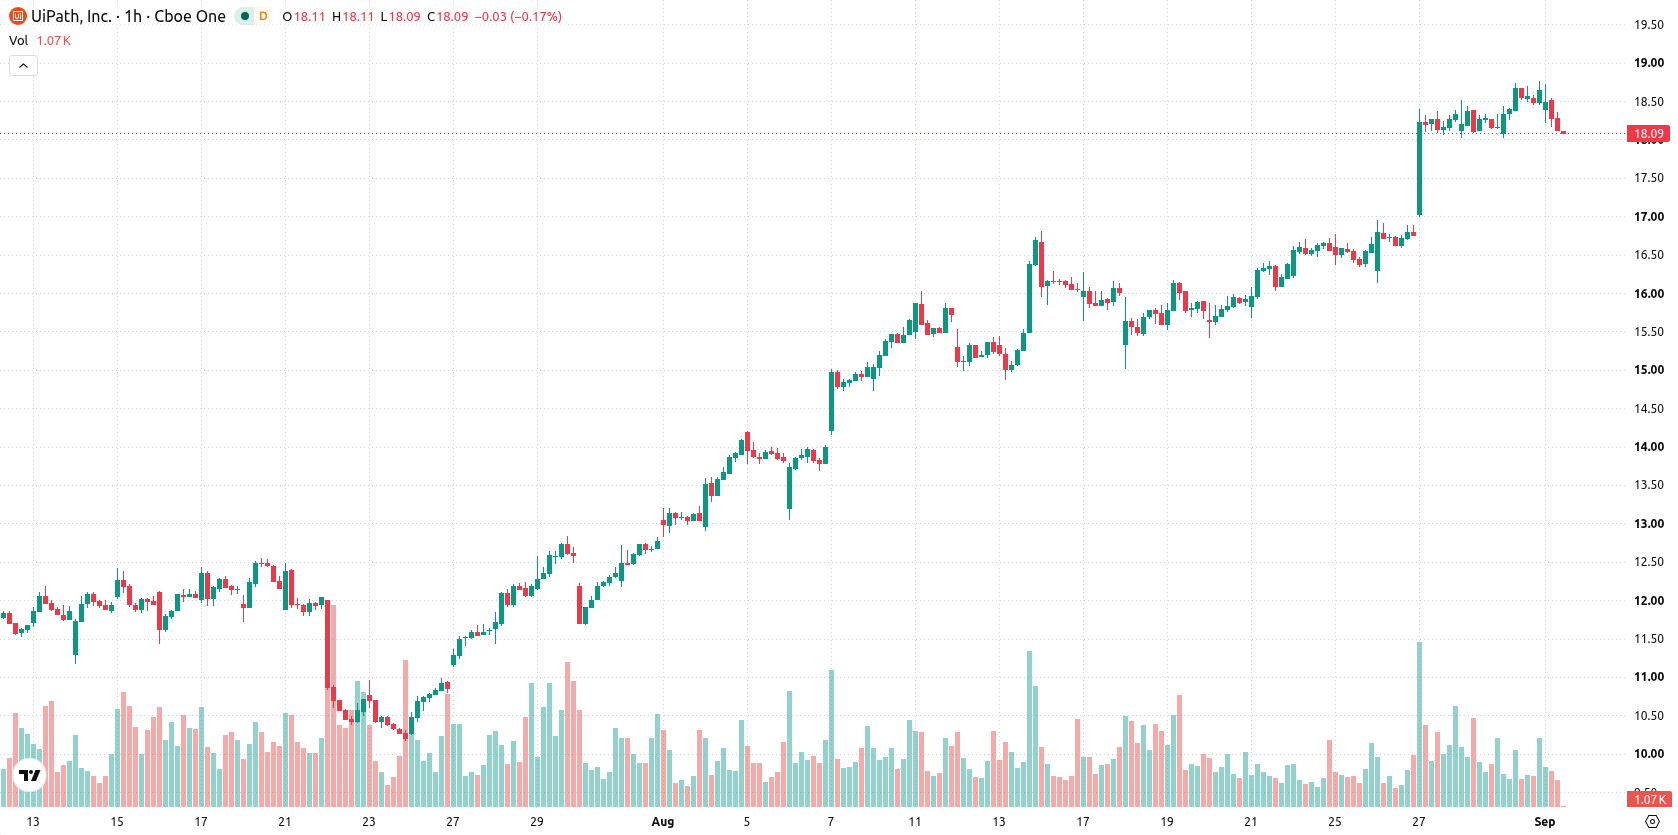
Bullish momentum and overbought signals diverge near key support levels
Technical analysis shows that PATH is trading below the MA-20 at $18.33, holding above the MA-50 at $17.26, and firmly above the MA-200 at $12.82. Immediate technical support stands at the Ichimoku Kijun level of $17.67. Momentum indicators are mostly strong, with MACD in Strong Buy territory and ADX suggesting a Buy. The RSI at 70.67 and Stochastic RSI both reflect Buy to Strong Buy signals, although CCI is overbought, pointing to stretched conditions. Bull/Bear Power demonstrates buyer dominance on an intraday basis, while the Awesome Oscillator offers a neutral read, not confirming the recent directional trend. There is some divergence, with upward momentum signals clashing with overbought oscillators and a session close near lows.
Range-bound trading likely as breakout and breakdown risks persist
Looking ahead to the next several sessions, PATH is forecasted to remain range-bound within a volatility band of $16.9 to $19.2, consistent with typical price action relative to current levels. Probabilities point toward a 68% chance of a move higher and a 32% chance of decline, so strength is seen as the more likely scenario. If the price can break above resistance near $19.2, further gains may follow; conversely, a move below support at $16.9 could open the way for additional softness.
In a recent review, analysts highlighted UiPath's ongoing technical strength but cautioned about mixed momentum signals and elevated risk of a near-term pullback. The current analysis builds on this framework by identifying $19.2 as a key resistance to watch, with a sustained break potentially marking a shift toward further upside ahead of the upcoming earnings release.










-
 Afghanistan
-
 Albania
-
 Algeria
-
 Angola
-
 Argentina
-
 Armenia
-
 Australia
-
 Austria
-
 Azerbaijan
-
 Bahamas
-
 Bahrain
-
 Bangladesh
-
 Belarus
-
 Belgium
-
 Bolivia
-
 Botswana
-
 Brazil
-
 Brunei
-
 Bulgaria
-
 Cambodia
-
 Cameroon
-
 Canada
-
 Chile
-
 China
-
 Colombia
-
 Congo
-
 Costa Rica
-
 Cote d'Ivoire
-
 Croatia
-
 Cuba
-
 Cyprus
-
 Czechia
-
 DR Congo
-
 Denmark
-
 Dominican Republic
-
 Ecuador
-
 Egypt
-
 El Salvador
-
 Estonia
-
 Eswatini
-
 Ethiopia
-
 Finland
-
 France
-
 Georgia
-
 Germany
-
 Ghana
-
 Greece
-
 Haiti
-
 Hong Kong
-
 Hungary
-
 India
-
 Indonesia
-
 Iran, Islamic republic
-
 Iraq
-
 Ireland
-
 Israel
-
 Italy
-
 Jamaica
-
 Japan
-
 Jordan
-
 Kazakhstan
-
 Kenya
-
 Korea
-
 Kuwait
-
 Kyrgyzstan
-
 Laos
-
 Latvia
-
 Lebanon
-
 Lesotho
-
 Libya
-
 Lithuania
-
 Luxembourg
-
 Madagascar
-
 Malaysia
-
 Malta
-
 Mauritius
-
 Mexico
-
 Moldova
-
 Mongolia
-
 Montenegro
-
 Morocco
-
 Mozambique
-
 Myanmar
-
 Namibia
-
 Nepal
-
 Netherlands
-
 New Zealand
-
 Nigeria
-
 North Macedonia
-
 Norway
-
 Oman
-
 Pakistan
-
 Palestine
-
 Panama
-
 Papua New Guinea
-
 Paraguay
-
 Peru
-
 Philippines
-
 Poland
-
 Portugal
-
 Puerto Rico
-
 Qatar
-
 Reunion
-
 Romania
-
 Rwanda
-
 Saudi Arabia
-
 Serbia
-
 Singapore
-
 Slovakia
-
 Slovenia
-
 Somalia
-
 South Africa
-
 Spain
-
 Sri Lanka
-
 Sweden
-
 Switzerland
-
 Syria
-
 Taiwan
-
 Tajikistan
-
 Tanzania
-
 Thailand
-
 Trinidad and Tobago
-
 Tunisia
-
 Turkey
-
 UAE
-
 Uganda
-
 Ukraine
-
 United Kingdom
-
United States
-
 Uruguay
-
 Uzbekistan
-
 Venezuela
-
 Vietnam
-
 Yemen
-
 Zambia
-
 Zimbabwe
- Forex
- Crypto












