

Steel Dynamics stock rally continues as strong upward momentum supports further gains

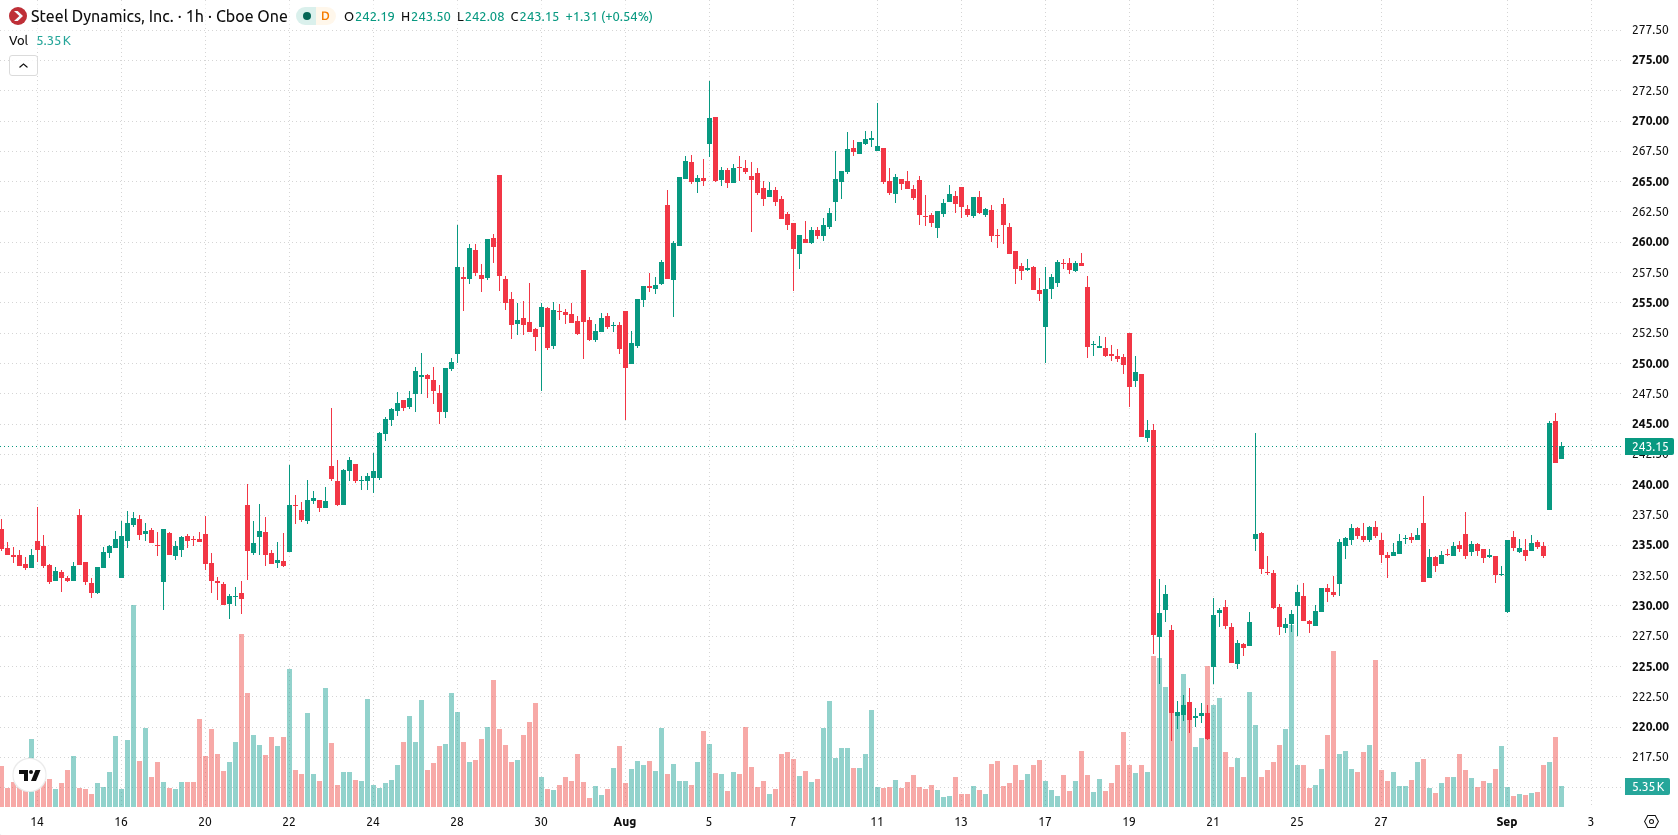
Steel Dynamics (STLD) stock is trading at $243.18 after a daily gain of 3.88%. The price remains above its key moving averages, highlighting continued upward momentum.
 229.86
252.59
Highlights
- Steel Dynamics stock attracts income investors with an 18% payout ratio and consistent dividend growth supporting long-term capital returns.
- Strong profitability and recent earnings growth lower risk perceptions and provide a stable foundation for shareholders.
- Shares of Steel Dynamics gained 3.88% to $243.18 with technical indicators showing a bullish structure but overbought conditions suggest a risk of short-term pullback within a projected range of $238.85 to $255.68.
Income appeal rises as dividend growth outpaces low payout ratio
Steel Dynamics is benefiting from solid dividend growth alongside a notably low payout ratio of just 18%, mechanisms that directly attract income-focused investors while confirming sustainability in capital return policies, according to Chartmill. Healthy fundamentals and ongoing profitability reduce risk perceptions and offer a stable platform for long-term shareholders. Recent strong earnings growth further highlights operational momentum and strengthens the case for continued buying interest in the stock.
Overbought signals emerge amid buyer dominance and stretched conditions
Technical levels for STLD show the price holding above the MA-20 at $235.44 and MA-50 at $233.94 on the hourly chart, with the long-term MA-200 further below at $208.96. The Ichimoku Kijun at $237.39 acts as immediate support. Both MACD and Awesome Oscillator produce Buy signals, while ADX indicates neutral trend strength. Several oscillators—including RSI at 72.38, Stoch RSI, CCI, and Bull/Bear Power—are in overbought territory, supporting the view of strong buyer dominance but also flagging a growing risk of a short-term pullback due to stretched market conditions.
Upside probabilities drive outlook within volatile trading channel
Looking forward, the anticipated trading range for the coming sessions is $238.85 to $255.68, reflecting the current volatility band relative to present levels. Probabilities skew to the upside with a 71% chance of further gains and a 29% likelihood of a down move. The baseline scenario sees price consolidating within this channel, while a bullish case could test resistance for new highs. Alternatively, a break below immediate support would increase the risk of a deeper retracement.
In a recent review, analysts highlighted that trade tensions and tariffs in the North American metals sector were driving sharp but uncertain adjustments for steel producers, with potential beneficiaries limited to those with robust domestic capacity and sound supply chains. The current technical setup for Steel Dynamics now presents a tightly defined trading channel between $238.85 and $255.68, making these levels critical for assessing near-term breakout or retracement risks.






Latest Steel Dynamics Inc News




-
 Afghanistan
-
 Albania
-
 Algeria
-
 Angola
-
 Argentina
-
 Armenia
-
 Australia
-
 Austria
-
 Azerbaijan
-
 Bahamas
-
 Bahrain
-
 Bangladesh
-
 Belarus
-
 Belgium
-
 Bolivia
-
 Botswana
-
 Brazil
-
 Brunei
-
 Bulgaria
-
 Cambodia
-
 Cameroon
-
 Canada
-
 Chile
-
 China
-
 Colombia
-
 Congo
-
 Costa Rica
-
 Cote d'Ivoire
-
 Croatia
-
 Cuba
-
 Cyprus
-
 Czechia
-
 DR Congo
-
 Denmark
-
 Dominican Republic
-
 Ecuador
-
 Egypt
-
 El Salvador
-
 Estonia
-
 Eswatini
-
 Ethiopia
-
 Finland
-
 France
-
 Georgia
-
 Germany
-
 Ghana
-
 Greece
-
 Haiti
-
 Hong Kong
-
 Hungary
-
 India
-
 Indonesia
-
 Iran, Islamic republic
-
 Iraq
-
 Ireland
-
 Israel
-
 Italy
-
 Jamaica
-
 Japan
-
 Jordan
-
 Kazakhstan
-
 Kenya
-
 Korea
-
 Kuwait
-
 Kyrgyzstan
-
 Laos
-
 Latvia
-
 Lebanon
-
 Lesotho
-
 Libya
-
 Lithuania
-
 Luxembourg
-
 Madagascar
-
 Malaysia
-
 Malta
-
 Mauritius
-
 Mexico
-
 Moldova
-
 Mongolia
-
 Montenegro
-
 Morocco
-
 Mozambique
-
 Myanmar
-
 Namibia
-
 Nepal
-
 Netherlands
-
 New Zealand
-
 Nigeria
-
 North Macedonia
-
 Norway
-
 Oman
-
 Pakistan
-
 Palestine
-
 Panama
-
 Papua New Guinea
-
 Paraguay
-
 Peru
-
 Philippines
-
 Poland
-
 Portugal
-
 Puerto Rico
-
 Qatar
-
 Reunion
-
 Romania
-
 Rwanda
-
 Saudi Arabia
-
 Serbia
-
 Singapore
-
 Slovakia
-
 Slovenia
-
 Somalia
-
 South Africa
-
 Spain
-
 Sri Lanka
-
 Sweden
-
 Switzerland
-
 Syria
-
 Taiwan
-
 Tajikistan
-
 Tanzania
-
 Thailand
-
 Trinidad and Tobago
-
 Tunisia
-
 Turkey
-
 UAE
-
 Uganda
-
 Ukraine
-
 United Kingdom
-
United States
-
 Uruguay
-
 Uzbekistan
-
 Venezuela
-
 Vietnam
-
 Yemen
-
 Zambia
-
 Zimbabwe
- Forex
- Crypto












