

Will CME Group stock hold $273.24 support as oversold conditions limit further selling?

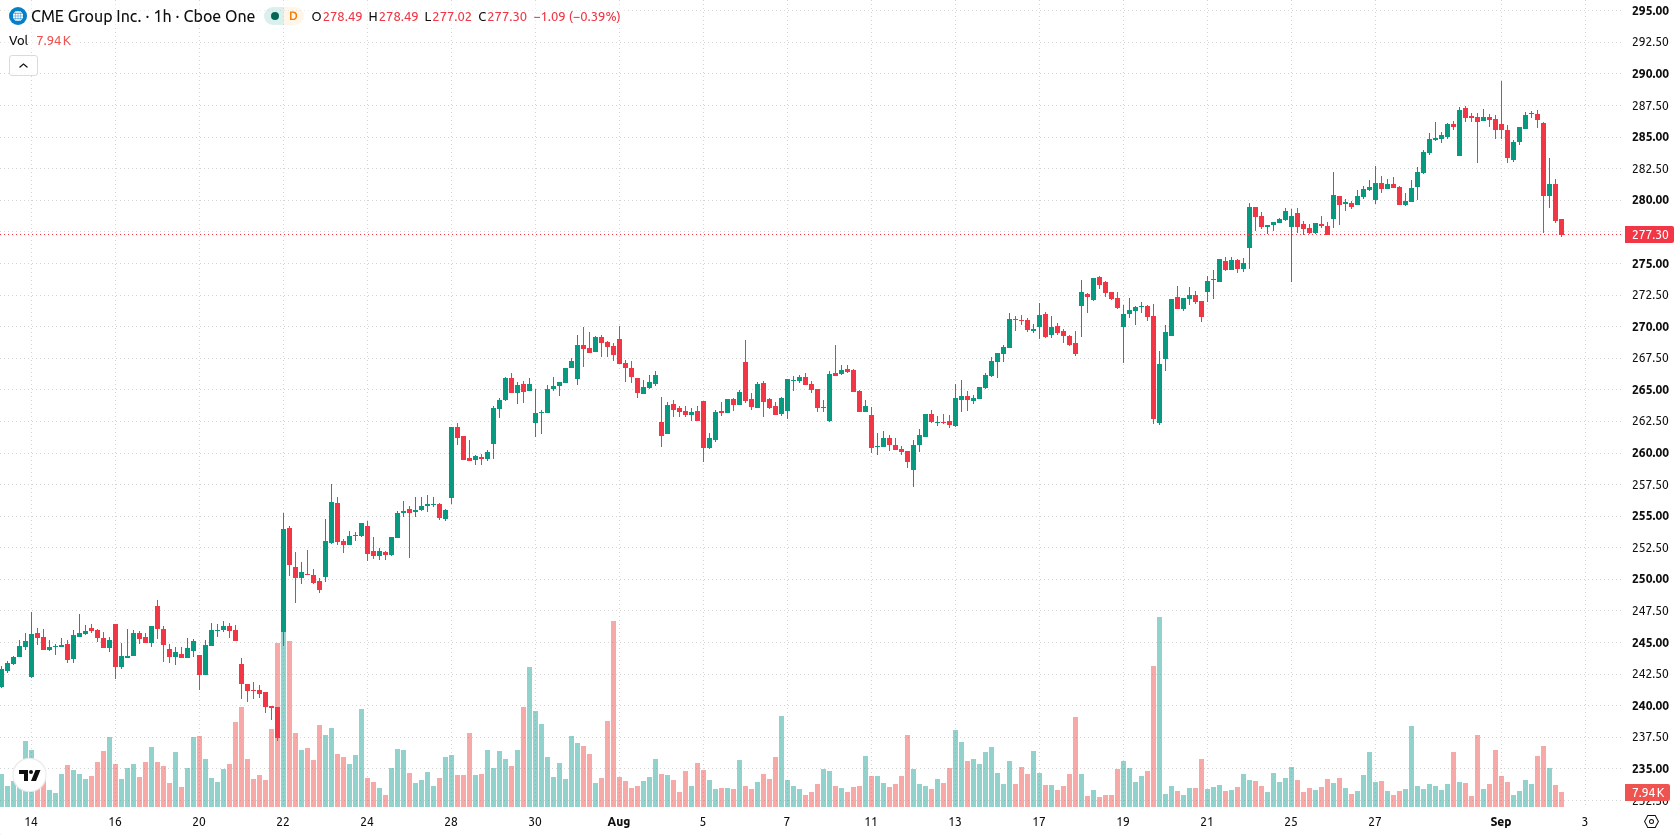
CME Group (CME) stock is trading at $277.48, reflecting a daily decline of 3.04%. The price remains below its key moving averages, indicating persistent negative momentum.
 306.46
Highlights
- CME Group reported August average daily volume of 29.7 million contracts, up 6% year-on-year and the second highest for the month.
- Increased participation in U.S. Treasury products drove a 15% rise in Treasury contract volumes and a 37% jump in 30-Year Treasury Bond futures.
- Shares of CME stock trade below key moving averages with bearish pressure, oscillators indicating oversold conditions, and a projected range of $273.24 to $285.77 in the coming days.
Institutional demand rises as fixed income volumes set records
CME Group reported its second-highest August average daily volume on record at 29.7 million contracts, representing a 6% year-on-year increase, according to Prnewswire. This surge in activity was driven in part by a 15% rise in U.S. Treasury average daily volume and a 37% increase in 30-Year U.S. Treasury Bond futures, reflecting heightened demand for CME’s fixed income products. The robust transaction volumes point to elevated institutional participation and support strong underlying business fundamentals, though price action has remained under broader selling pressure.
Oscillator weakness contrasts with buy signals below key resistance
On the hourly chart, CME is trading below the MA-20 at $285.7 and MA-50 at $282.04, while the daily chart shows the price remains under the MA-200 at $278.82. The Ichimoku Kijun at $284.68 marks immediate resistance. MACD reflects strong buy momentum, but ADX is neutral, suggesting ambiguous trend strength. RSI at 39.36, alongside Stoch RSI, CCI, and Bull/Bear Power, all indicate oversold or seller-dominated conditions intraday, highlighting a divergence between momentum and oscillator signals.
Sideways bias persists as breakout risks remain balanced
Over the short term, CME is expected to trade within a typical volatility band of $273.24 to $285.77, with the probability of an upward or downward breakout close to even. The baseline scenario envisions sideways movement within this range. A bullish outcome would see a break above the $284.68 resistance, potentially targeting the upper bound, while renewed selling below $273.24 could trigger further downside pressure.
Previously it was reported that CME Group expanded its U.S. electricity market offerings by launching ERCOT Power futures and options, while maintaining a generally constructive technical outlook. The current setup now points to heightened volatility and an unresolved trend, with traders advised to monitor $273.24 as a key downside risk level in the days ahead.






Latest CME Group News



-
 Afghanistan
-
 Albania
-
 Algeria
-
 Angola
-
 Argentina
-
 Armenia
-
 Australia
-
 Austria
-
 Azerbaijan
-
 Bahamas
-
 Bahrain
-
 Bangladesh
-
 Belarus
-
 Belgium
-
 Bolivia
-
 Botswana
-
 Brazil
-
 Brunei
-
 Bulgaria
-
 Cambodia
-
 Cameroon
-
 Canada
-
 Chile
-
 China
-
 Colombia
-
 Congo
-
 Costa Rica
-
 Cote d'Ivoire
-
 Croatia
-
 Cuba
-
 Cyprus
-
 Czechia
-
 DR Congo
-
 Denmark
-
 Dominican Republic
-
 Ecuador
-
 Egypt
-
 El Salvador
-
 Estonia
-
 Eswatini
-
 Ethiopia
-
 Finland
-
 France
-
 Georgia
-
 Germany
-
 Ghana
-
 Greece
-
 Haiti
-
 Hong Kong
-
 Hungary
-
 India
-
 Indonesia
-
 Iran, Islamic republic
-
 Iraq
-
 Ireland
-
 Israel
-
 Italy
-
 Jamaica
-
 Japan
-
 Jordan
-
 Kazakhstan
-
 Kenya
-
 Korea
-
 Kuwait
-
 Kyrgyzstan
-
 Laos
-
 Latvia
-
 Lebanon
-
 Lesotho
-
 Libya
-
 Lithuania
-
 Luxembourg
-
 Madagascar
-
 Malaysia
-
 Malta
-
 Mauritius
-
 Mexico
-
 Moldova
-
 Mongolia
-
 Montenegro
-
 Morocco
-
 Mozambique
-
 Myanmar
-
 Namibia
-
 Nepal
-
 Netherlands
-
 New Zealand
-
 Nigeria
-
 North Macedonia
-
 Norway
-
 Oman
-
 Pakistan
-
 Palestine
-
 Panama
-
 Papua New Guinea
-
 Paraguay
-
 Peru
-
 Philippines
-
 Poland
-
 Portugal
-
 Puerto Rico
-
 Qatar
-
 Reunion
-
 Romania
-
 Rwanda
-
 Saudi Arabia
-
 Serbia
-
 Singapore
-
 Slovakia
-
 Slovenia
-
 Somalia
-
 South Africa
-
 Spain
-
 Sri Lanka
-
 Sweden
-
 Switzerland
-
 Syria
-
 Taiwan
-
 Tajikistan
-
 Tanzania
-
 Thailand
-
 Trinidad and Tobago
-
 Tunisia
-
 Turkey
-
 UAE
-
 Uganda
-
 Ukraine
-
 United Kingdom
-
United States
-
 Uruguay
-
 Uzbekistan
-
 Venezuela
-
 Vietnam
-
 Yemen
-
 Zambia
-
 Zimbabwe
- Forex
- Crypto












