

Can lower operating costs support Oracle stock gains?

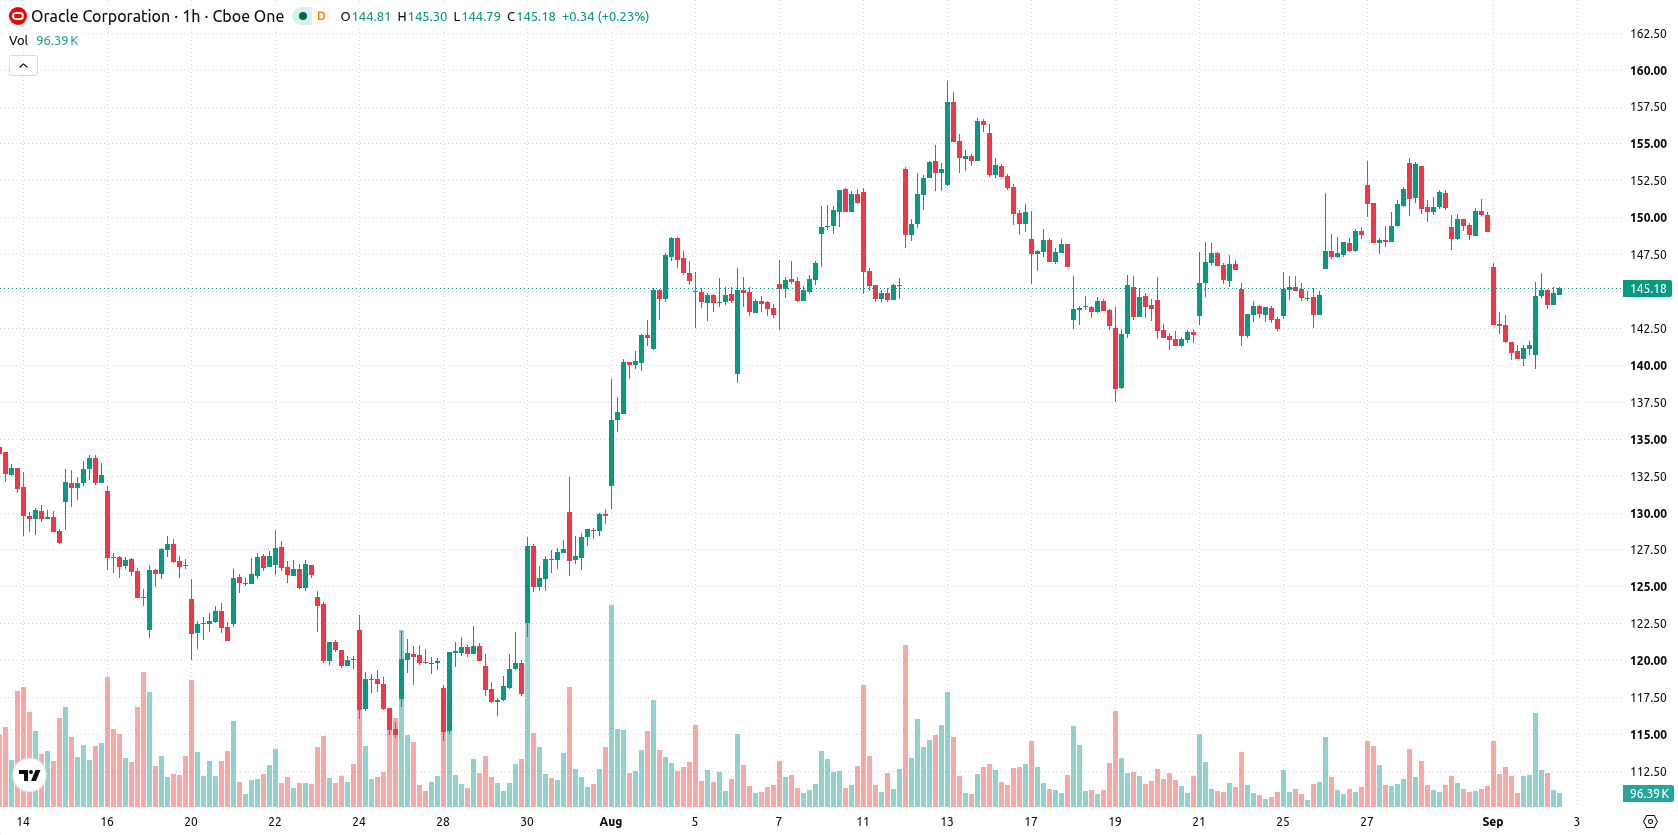
Oracle (ORCL) stock is trading at $146.02, up 3.33% on the day. The price is positioned below its key moving averages, reflecting soft performance relative to recent price trends.
 125.76
130.76
Highlights
- Oracle agreed to a multi-year partnership with Quantinuum to incorporate quantum computing capabilities into Oracle Cloud Infrastructure.
- Oracle implemented a 13% workforce reduction and recorded $1.8 billion in restructuring charges to streamline operations for profitability, while facing EU antitrust scrutiny over licensing practices.
- Shares of Oracle trade below key moving averages with short- and medium-term bearish signals, and are expected to remain between $139.87 to $152.17 in coming sessions.
Quantum partnership and layoffs drive demand and raise regulatory risks
Oracle has announced a multi-year strategic partnership with Quantinuum to bring quantum computing capabilities to Oracle Cloud Infrastructure, deploying Quantinuum’s Helios quantum computer in a U.S.-based Oracle AI data center, according to Investing.com. This move expands Oracle’s cloud offerings and is likely fueling demand from enterprise customers seeking advanced quantum-AI workloads. In addition, Oracle recently implemented a 13% headcount reduction and incurred $1.8 billion in restructuring charges for the fiscal year, steps aimed at streamlining operations and enhancing future profitability. Its licensing practices have also come under EU antitrust scrutiny, raising some regulatory risks for the company.
Mixed momentum as ORCL faces resistance and bearish signals
Technical levels show ORCL trading below the MA-20 ($146.82) and MA-50 ($146.83) on the H1 timeframe, as well as below the MA-200 at $169.78 on the daily chart. The Ichimoku Kijun sits at $146.87, acting as immediate resistance. Among momentum indicators, MACD and ADX both indicate selling pressure. RSI reads 46.55 (Sell), CCI signals Sell, while Stochastic RSI is Neutral. Bull/Bear Power suggests intraday buyer dominance, even as the overall momentum picture remains mixed. Awesome Oscillator is neutral, highlighting conflicting short-term signals.
Consolidation likely as volatility and range-bound outlook persist
Over the next several sessions, the price is expected to remain within a band between $139.87 and $152.17, reflecting recent volatility. Scenario probabilities are evenly split, with a 50% chance for either an upward or downward move. Baseline expectation is for consolidation within this range. A bullish scenario would be triggered by a break above the Kijun and the upper band, while a bearish case would see price falling below the projected range, signaling increased downside risk.
Previously it was reported that Oracle faced ongoing market uncertainty driven by mixed technical signals and the impact of major workforce restructuring in support of its AI initiatives. The current article adds fresh perspective with the launch of a quantum computing partnership, yet with regulatory risks and operational adjustments still in play, traders should focus on the $139.87–$152.17 consolidation range for signs of a breakout or further downside risk.










-
 Afghanistan
-
 Albania
-
 Algeria
-
 Angola
-
 Argentina
-
 Armenia
-
 Australia
-
 Austria
-
 Azerbaijan
-
 Bahamas
-
 Bahrain
-
 Bangladesh
-
 Belarus
-
 Belgium
-
 Bolivia
-
 Botswana
-
 Brazil
-
 Brunei
-
 Bulgaria
-
 Cambodia
-
 Cameroon
-
 Canada
-
 Chile
-
 China
-
 Colombia
-
 Congo
-
 Costa Rica
-
 Cote d'Ivoire
-
 Croatia
-
 Cuba
-
 Cyprus
-
 Czechia
-
 DR Congo
-
 Denmark
-
 Dominican Republic
-
 Ecuador
-
 Egypt
-
 El Salvador
-
 Estonia
-
 Eswatini
-
 Ethiopia
-
 Finland
-
 France
-
 Georgia
-
 Germany
-
 Ghana
-
 Greece
-
 Haiti
-
 Hong Kong
-
 Hungary
-
 India
-
 Indonesia
-
 Iran, Islamic republic
-
 Iraq
-
 Ireland
-
 Israel
-
 Italy
-
 Jamaica
-
 Japan
-
 Jordan
-
 Kazakhstan
-
 Kenya
-
 Korea
-
 Kuwait
-
 Kyrgyzstan
-
 Laos
-
 Latvia
-
 Lebanon
-
 Lesotho
-
 Libya
-
 Lithuania
-
 Luxembourg
-
 Madagascar
-
 Malaysia
-
 Malta
-
 Mauritius
-
 Mexico
-
 Moldova
-
 Mongolia
-
 Montenegro
-
 Morocco
-
 Mozambique
-
 Myanmar
-
 Namibia
-
 Nepal
-
 Netherlands
-
 New Zealand
-
 Nigeria
-
 North Macedonia
-
 Norway
-
 Oman
-
 Pakistan
-
 Palestine
-
 Panama
-
 Papua New Guinea
-
 Paraguay
-
 Peru
-
 Philippines
-
 Poland
-
 Portugal
-
 Puerto Rico
-
 Qatar
-
 Reunion
-
 Romania
-
 Rwanda
-
 Saudi Arabia
-
 Serbia
-
 Singapore
-
 Slovakia
-
 Slovenia
-
 Somalia
-
 South Africa
-
 Spain
-
 Sri Lanka
-
 Sweden
-
 Switzerland
-
 Syria
-
 Taiwan
-
 Tajikistan
-
 Tanzania
-
 Thailand
-
 Trinidad and Tobago
-
 Tunisia
-
 Turkey
-
 UAE
-
 Uganda
-
 Ukraine
-
 United Kingdom
-
United States
-
 Uruguay
-
 Uzbekistan
-
 Venezuela
-
 Vietnam
-
 Yemen
-
 Zambia
-
 Zimbabwe
- Forex
- Crypto












