

RKT consolidates as strong selling pressure continues

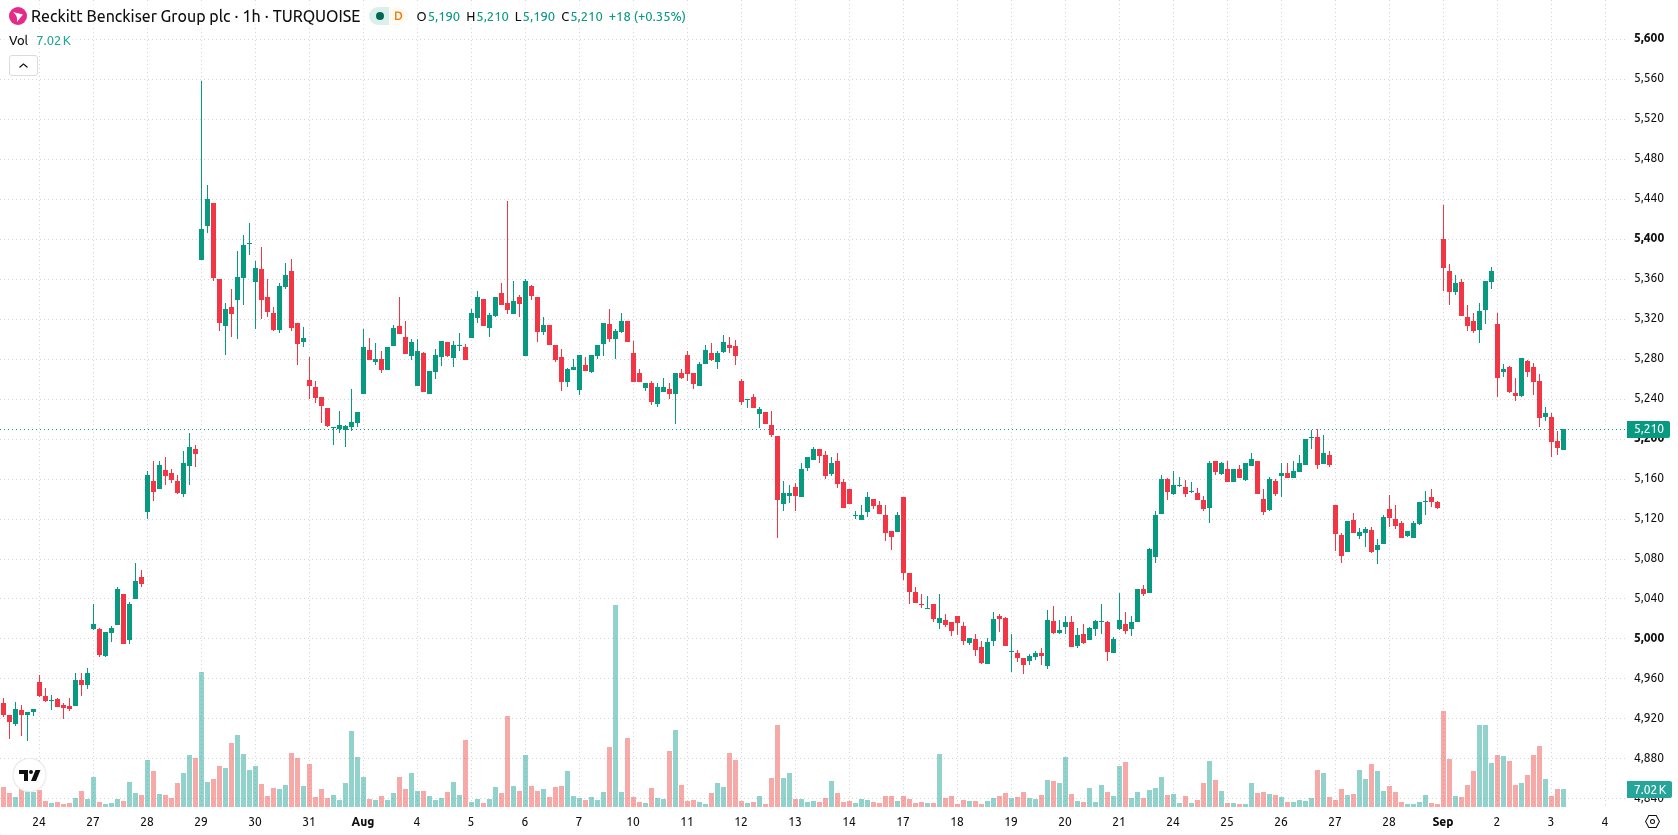
Reckitt Benckiser (RKT) stock is trading at GBX5,204 after a modest decline in the latest session. The price sits below its short- and long-term moving averages but remains above its mid-term benchmark, reflecting a mixed technical backdrop.
 5718.00
5728.00
Highlights
- RKT/GBX stock is experiencing short-term downward pressure, with prices trading below key short-term and long-term moving averages.
- Oscillators show oversold conditions and persistent seller pressure, but ADX suggests underlying strength and a risk of short-term reversal.
- Price is forecast to fluctuate between GBX5,053 and GBX5,354 in coming sessions, with 50% probability for up or down moves within this range.
Seller dominance as resistance holds and momentum turns mixed
RKT/GBX is trading below its MA-20 at GBX5,287 and MA-200 at GBX5,395, while it remains above the MA-50 at GBX5,196. The Ichimoku Kijun at GBX5,268 presents immediate resistance and could limit any short-term rebounds. Momentum readings are mixed: MACD indicates a neutral setup, while ADX points to buy conditions. However, RSI at 43.15, Stochastic RSI, CCI, and Bull/Bear Power all signal sell or oversold conditions, underscoring dominant seller pressure. Awesome Oscillator is neutral, failing to confirm a clear trend. Price action exhibits low volatility and sits in the mid-range following an intraday gap lower.
Range-bound outlook as resistance and support define near-term risk
In the short term, RKT is likely to fluctuate within a volatility band between GBX5,053 and GBX5,354, with the probability of a move in either direction estimated at 50%. The baseline expectation is for continued sideways price action within this corridor. A break above resistance at GBX5,268 would open a bullish scenario, while a drop below support would increase downside risk toward the lower end of the expected range.
Earlier, analysts noted that Reckitt Benckiser's technical picture was underpinned by reduced litigation risk and the potential for a breakout as volatility guided price action. The current setup adds a dimension of increased uncertainty, making the next directional move especially dependent on a break beyond the prevailing resistance or support levels.











-
 Afghanistan
-
 Albania
-
 Algeria
-
 Angola
-
 Argentina
-
 Armenia
-
 Australia
-
 Austria
-
 Azerbaijan
-
 Bahamas
-
 Bahrain
-
 Bangladesh
-
 Belarus
-
 Belgium
-
 Bolivia
-
 Botswana
-
 Brazil
-
 Brunei
-
 Bulgaria
-
 Cambodia
-
 Cameroon
-
 Canada
-
 Chile
-
 China
-
 Colombia
-
 Congo
-
 Costa Rica
-
 Cote d'Ivoire
-
 Croatia
-
 Cuba
-
 Cyprus
-
 Czechia
-
 DR Congo
-
 Denmark
-
 Dominican Republic
-
 Ecuador
-
 Egypt
-
 El Salvador
-
 Estonia
-
 Eswatini
-
 Ethiopia
-
 Finland
-
 France
-
 Georgia
-
 Germany
-
 Ghana
-
 Greece
-
 Haiti
-
 Hong Kong
-
 Hungary
-
 India
-
 Indonesia
-
 Iran, Islamic republic
-
 Iraq
-
 Ireland
-
 Israel
-
 Italy
-
 Jamaica
-
 Japan
-
 Jordan
-
 Kazakhstan
-
 Kenya
-
 Korea
-
 Kuwait
-
 Kyrgyzstan
-
 Laos
-
 Latvia
-
 Lebanon
-
 Lesotho
-
 Libya
-
 Lithuania
-
 Luxembourg
-
 Madagascar
-
 Malaysia
-
 Malta
-
 Mauritius
-
 Mexico
-
 Moldova
-
 Mongolia
-
 Montenegro
-
 Morocco
-
 Mozambique
-
 Myanmar
-
 Namibia
-
 Nepal
-
 Netherlands
-
 New Zealand
-
 Nigeria
-
 North Macedonia
-
 Norway
-
 Oman
-
 Pakistan
-
 Palestine
-
 Panama
-
 Papua New Guinea
-
 Paraguay
-
 Peru
-
 Philippines
-
 Poland
-
 Portugal
-
 Puerto Rico
-
 Qatar
-
 Reunion
-
 Romania
-
 Rwanda
-
 Saudi Arabia
-
 Serbia
-
 Singapore
-
 Slovakia
-
 Slovenia
-
 Somalia
-
 South Africa
-
 Spain
-
 Sri Lanka
-
 Sweden
-
 Switzerland
-
 Syria
-
 Taiwan
-
 Tajikistan
-
 Tanzania
-
 Thailand
-
 Trinidad and Tobago
-
 Tunisia
-
 Turkey
-
 UAE
-
 Uganda
-
 Ukraine
-
 United Kingdom
-
United States
-
 Uruguay
-
 Uzbekistan
-
 Venezuela
-
 Vietnam
-
 Yemen
-
 Zambia
-
 Zimbabwe
- Forex
- Crypto












