

PepsiCo stock holds narrow range with buyers and sellers at a stalemate: weekly analysis

Shares of PepsiCo, Inc. (PEP) are trading near $140.5, with the stock still struggling to reverse its recent decline. The daily chart highlights mixed technical signals as buyers and sellers remain locked in a tight stalemate ahead of the new week.
 142.08
145.50
Highlights
- Shares of PepsiCo closed at $140.5 after moving within a narrow 1.66% weekly range and remain below long-term resistance.
- Price action is capped by short-term resistance as mixed momentum signals support further sideways trading between $139.73 and $140.55.
- The forecast for next week is consolidation within $136.67 to $141.53, with downside risk prevailing at a 63% probability.
Dividend affirmation and cautious guidance drive investor positioning this week
PepsiCo declared a quarterly dividend of $1.48 per share, with a forward yield of 4.2%, according to Markets Daily and The Motley Fool, providing continued income appeal to investors. The company reaffirmed its 2026 guidance for organic revenue and constant-currency EPS growth after reporting Q2 2026 revenue of $24.18 billion and a core EPS of $2.20, a stance described as cautious by some. Interest from Quantitative Investment Management LLC was confirmed as they acquired 70,754 shares, valued at roughly $9.58 million, as reported by Markets Daily.
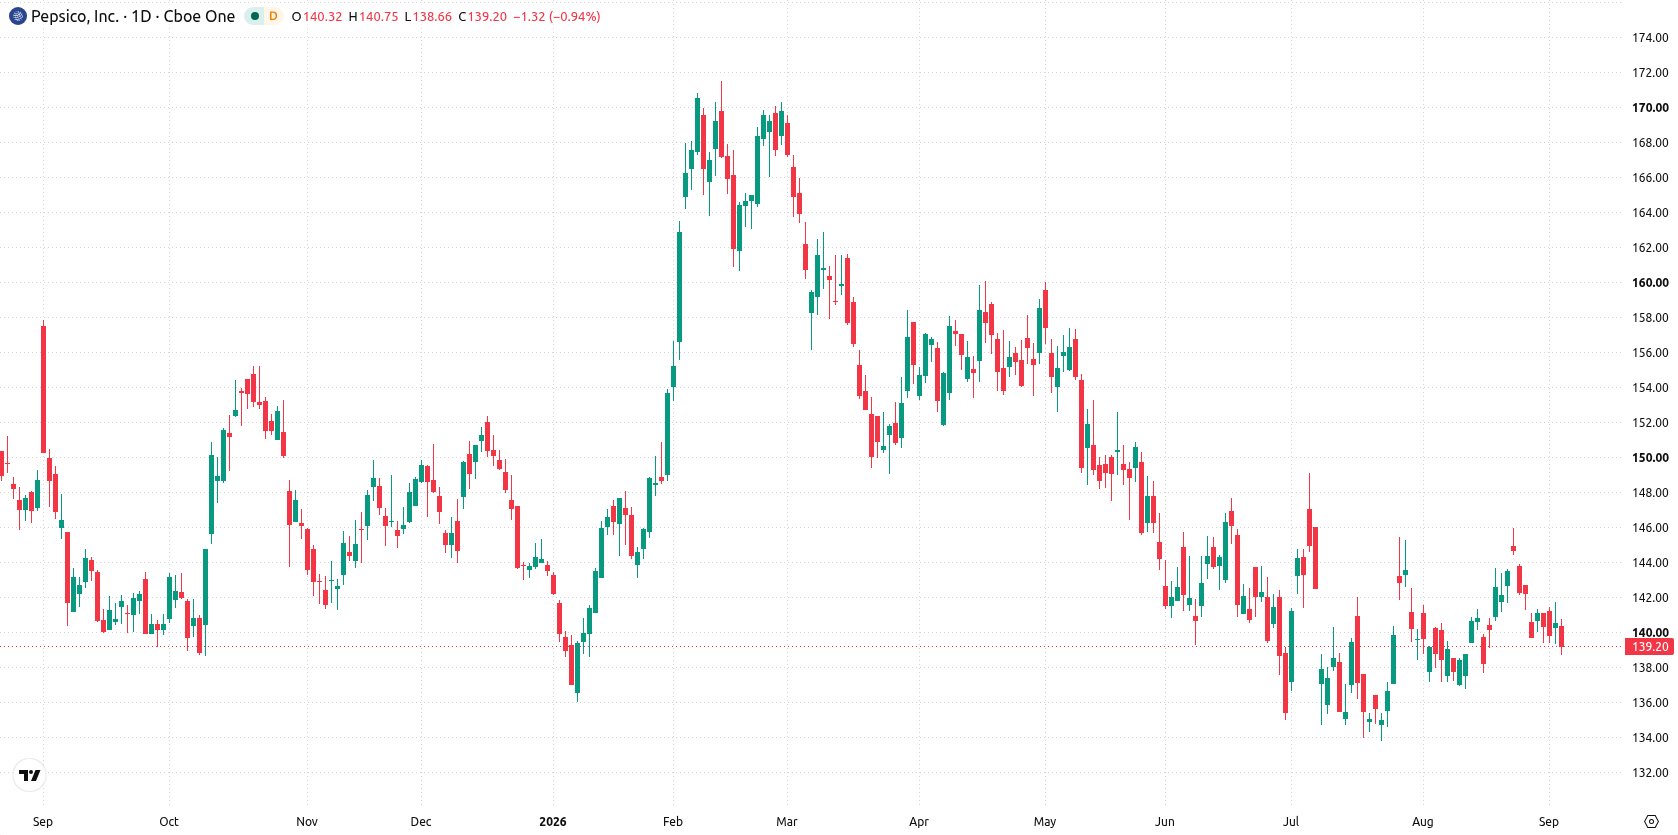
Narrow resistance test shapes sideways momentum as mixed signals dominate
On the daily chart, PepsiCo is consolidating right at short-term resistance, with a contained move within a narrow range. MACD gives a bullish signal while Bull/Bear Power flags overbought conditions, pointing to mixed momentum against a flat trend. The nearest support is found at the 50-day moving average of $139.73, while immediate resistance is at $140.55, with the Ichimoku Kijun higher at $141.27 acting as another cap. This technical setup suggests further sideways action as the bulls and bears contest a tight band, echoing the recent lack of conviction.
Consolidation expected next week as breakout risk hinges on key levels
Next week, the expected range is $136.67 to $141.53. There is a 37% probability of an increase and a 63% probability of a decrease. The base case is further consolidation between $139.73 support and $140.55 resistance. A break above $140.55 could target the upper end near $141.27, while a move below $139.73 exposes downside risk toward $136.67.
Earlier, analysts noted that PepsiCo shares were locked in a narrow consolidation phase, with mixed technical signals limiting a decisive move in either direction. The latest action maintains this indecisive backdrop, making the $139.73 to $140.55 band the key zone for traders to monitor as the next potential catalyst emerges.









-
 Afghanistan
-
 Albania
-
 Algeria
-
 Angola
-
 Argentina
-
 Armenia
-
 Australia
-
 Austria
-
 Azerbaijan
-
 Bahamas
-
 Bahrain
-
 Bangladesh
-
 Belarus
-
 Belgium
-
 Bolivia
-
 Botswana
-
 Brazil
-
 Brunei
-
 Bulgaria
-
 Cambodia
-
 Cameroon
-
 Canada
-
 Chile
-
 China
-
 Colombia
-
 Congo
-
 Costa Rica
-
 Cote d'Ivoire
-
 Croatia
-
 Cuba
-
 Cyprus
-
 Czechia
-
 DR Congo
-
 Denmark
-
 Dominican Republic
-
 Ecuador
-
 Egypt
-
 El Salvador
-
 Estonia
-
 Eswatini
-
 Ethiopia
-
 Finland
-
 France
-
 Georgia
-
 Germany
-
 Ghana
-
 Greece
-
 Haiti
-
 Hong Kong
-
 Hungary
-
 India
-
 Indonesia
-
 Iran, Islamic republic
-
 Iraq
-
 Ireland
-
 Israel
-
 Italy
-
 Jamaica
-
 Japan
-
 Jordan
-
 Kazakhstan
-
 Kenya
-
 Korea
-
 Kuwait
-
 Kyrgyzstan
-
 Laos
-
 Latvia
-
 Lebanon
-
 Lesotho
-
 Libya
-
 Lithuania
-
 Luxembourg
-
 Madagascar
-
 Malaysia
-
 Malta
-
 Mauritius
-
 Mexico
-
 Moldova
-
 Mongolia
-
 Montenegro
-
 Morocco
-
 Mozambique
-
 Myanmar
-
 Namibia
-
 Nepal
-
 Netherlands
-
 New Zealand
-
 Nigeria
-
 North Macedonia
-
 Norway
-
 Oman
-
 Pakistan
-
 Palestine
-
 Panama
-
 Papua New Guinea
-
 Paraguay
-
 Peru
-
 Philippines
-
 Poland
-
 Portugal
-
 Puerto Rico
-
 Qatar
-
 Reunion
-
 Romania
-
 Rwanda
-
 Saudi Arabia
-
 Serbia
-
 Singapore
-
 Slovakia
-
 Slovenia
-
 Somalia
-
 South Africa
-
 Spain
-
 Sri Lanka
-
 Sweden
-
 Switzerland
-
 Syria
-
 Taiwan
-
 Tajikistan
-
 Tanzania
-
 Thailand
-
 Trinidad and Tobago
-
 Tunisia
-
 Turkey
-
 UAE
-
 Uganda
-
 Ukraine
-
 United Kingdom
-
United States
-
 Uruguay
-
 Uzbekistan
-
 Venezuela
-
 Vietnam
-
 Yemen
-
 Zambia
-
 Zimbabwe
- Forex
- Crypto












