

Coca-Cola stock rebound potential emerges as Stochastic RSI signals deep oversold zone: weekly analysis

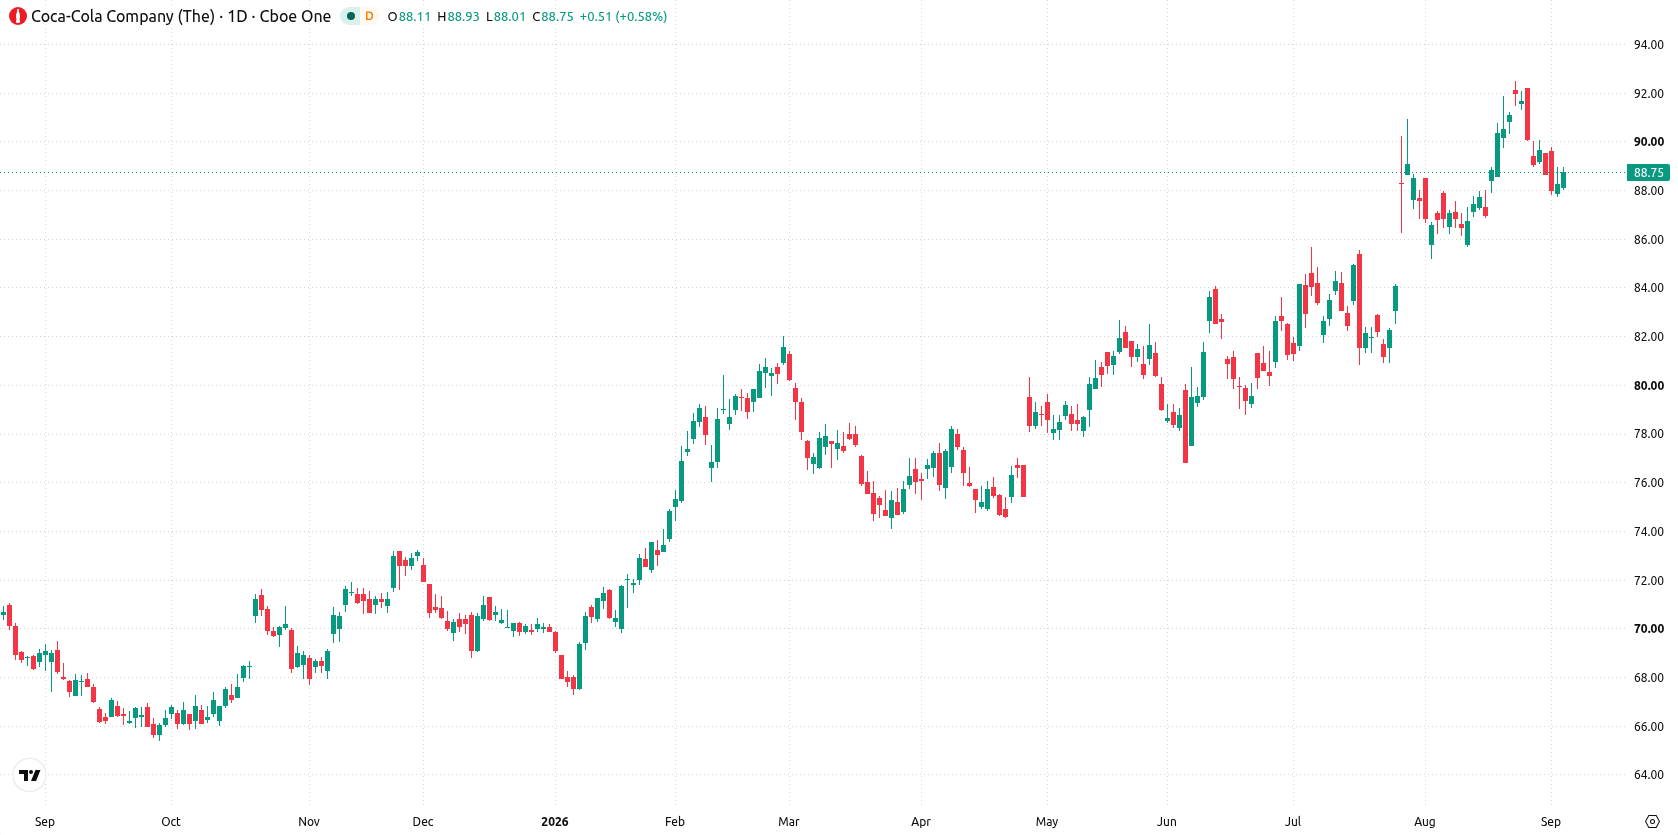
Shares of The Coca-Cola Company (KO) are trading near $88, retreating more than 1% this week as the recent decline stretches into oversold territory. Technical indicators are sending mixed signals, leaving the near-term direction uncertain despite the underlying momentum. The coming week hinges on whether buyers can defend key support or if the latest pullback extends further.
 93.14
94.79
Highlights
- Shares of Coca-Cola fell 1.38% over the past week to $88.43, trading near short-term resistance.
- Technical indicators are mixed with some oversold signals, suggesting potential for a rebound or further downside.
- Expected price range for the coming week is $86.11 to $91.07, with a 71% probability of an increase.
Record earnings and upbeat outlook buoy sentiment despite recent retreat
Coca-Cola reported stronger-than-expected Q2 2026 results, with Seeking Alpha and several financial outlets highlighting a 7% increase in net revenue, 5% volume growth, and a 16% rise in earnings per share. According to 24/7 Wall St. and ad-hoc-news.de, KO raised its full-year 2026 free cash flow outlook to $12.4 billion, while quarterly operating cash flow improved to $5.522 billion. The board also declared a $0.53 per share dividend with an ex-dividend date of September 15, 2026, continuing its streak of annual increases. The recently announced all-time highs and strong earnings track record are likely to influence sentiment through next week.
Rebound potential emerges as multiple indicators flag oversold conditions
On the daily chart, Coca-Cola stock is holding at its MA-20 while testing a key band between immediate resistance at $88.71 and the Ichimoku Kijun at $88.82, both acting as resistance. Momentum signals are mixed, with the Stochastic RSI deep in the oversold zone at 11.08, hinting at a potential rebound, while MACD shows a strong buy forecast, supporting the bullish setup, even as Bull/Bear Power remains in oversold territory. Volatility over the past week stands at a moderate 2.5%. This position, coupled with an emerging move lower that is not yet confirmed, leaves the near-term setup finely balanced between reversal potential and downside risk.
Tight trading range favored unless resistance breach triggers upside breakout
For the coming trading week, the expected price range is $86.11 to $91.07. There is a 71% probability of an increase and a 29% chance of a decrease. The base case is continued range trading unless the stock breaks through resistance at $88.71; in that bullish scenario, a test of $91.07 becomes likely. If price falls below support at $87.83, deeper losses toward $86.11 could unfold.
Previously it was reported that Coca-Cola's resilient fundamentals and steady dividend growth supported a constructive but cautious outlook amid technical warning signals. The current analysis adds a new layer by highlighting mixed momentum and reinforced earnings strength, making a break of $88.71 resistance the key level to watch for potential upside next week.











-
 Afghanistan
-
 Albania
-
 Algeria
-
 Angola
-
 Argentina
-
 Armenia
-
 Australia
-
 Austria
-
 Azerbaijan
-
 Bahamas
-
 Bahrain
-
 Bangladesh
-
 Belarus
-
 Belgium
-
 Bolivia
-
 Botswana
-
 Brazil
-
 Brunei
-
 Bulgaria
-
 Cambodia
-
 Cameroon
-
 Canada
-
 Chile
-
 China
-
 Colombia
-
 Congo
-
 Costa Rica
-
 Cote d'Ivoire
-
 Croatia
-
 Cuba
-
 Cyprus
-
 Czechia
-
 DR Congo
-
 Denmark
-
 Dominican Republic
-
 Ecuador
-
 Egypt
-
 El Salvador
-
 Estonia
-
 Eswatini
-
 Ethiopia
-
 Finland
-
 France
-
 Georgia
-
 Germany
-
 Ghana
-
 Greece
-
 Haiti
-
 Hong Kong
-
 Hungary
-
 India
-
 Indonesia
-
 Iran, Islamic republic
-
 Iraq
-
 Ireland
-
 Israel
-
 Italy
-
 Jamaica
-
 Japan
-
 Jordan
-
 Kazakhstan
-
 Kenya
-
 Korea
-
 Kuwait
-
 Kyrgyzstan
-
 Laos
-
 Latvia
-
 Lebanon
-
 Lesotho
-
 Libya
-
 Lithuania
-
 Luxembourg
-
 Madagascar
-
 Malaysia
-
 Malta
-
 Mauritius
-
 Mexico
-
 Moldova
-
 Mongolia
-
 Montenegro
-
 Morocco
-
 Mozambique
-
 Myanmar
-
 Namibia
-
 Nepal
-
 Netherlands
-
 New Zealand
-
 Nigeria
-
 North Macedonia
-
 Norway
-
 Oman
-
 Pakistan
-
 Palestine
-
 Panama
-
 Papua New Guinea
-
 Paraguay
-
 Peru
-
 Philippines
-
 Poland
-
 Portugal
-
 Puerto Rico
-
 Qatar
-
 Reunion
-
 Romania
-
 Rwanda
-
 Saudi Arabia
-
 Serbia
-
 Singapore
-
 Slovakia
-
 Slovenia
-
 Somalia
-
 South Africa
-
 Spain
-
 Sri Lanka
-
 Sweden
-
 Switzerland
-
 Syria
-
 Taiwan
-
 Tajikistan
-
 Tanzania
-
 Thailand
-
 Trinidad and Tobago
-
 Tunisia
-
 Turkey
-
 UAE
-
 Uganda
-
 Ukraine
-
 United Kingdom
-
United States
-
 Uruguay
-
 Uzbekistan
-
 Venezuela
-
 Vietnam
-
 Yemen
-
 Zambia
-
 Zimbabwe
- Forex
- Crypto












