

Reckitt Benckiser stock forecast: Consolidation near GBX5,216 resistance

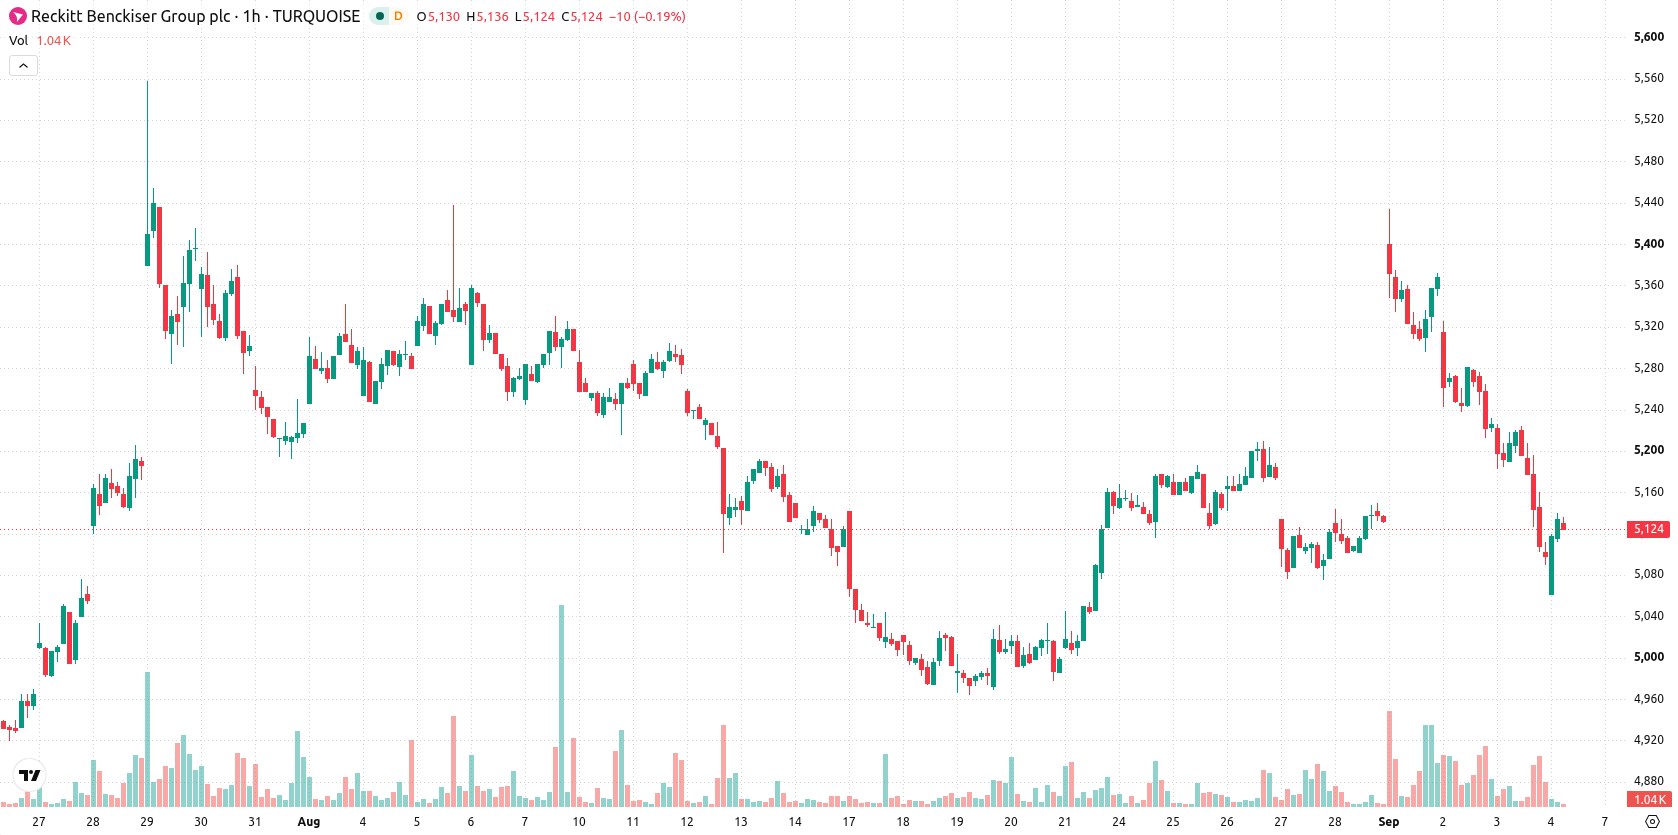
Reckitt Benckiser (RKT) stock is trading at GBX5,116 after a modest intraday gain. The price movement remains below its key moving averages, highlighting continuing pressure from sellers in both the short and longer term.
 5718.00
5728.00
Highlights
- RKT/GBX trades below short-, medium-, and long-term moving averages, indicating persistent downward pressure on the stock.
- Bearish momentum dominates as multiple indicators flag oversold conditions without clear signs of reversal emerging.
- Price closed at GBX5,116, with an expected range of GBX4,952 to GBX5,267 and a 75% probability of a further decline.
Bearish momentum confirmed as oversold signals fail at resistance
On the hourly chart, RKT is below the MA-20 at GBX5,204 and MA-50 at GBX5,194, while the daily price remains suppressed under the MA-200 at GBX5,391. The Ichimoku Kijun provides immediate resistance at GBX5,216. Momentum signals are largely bearish: MACD is on Sell, ADX is Neutral, and the RSI reads 35.94, which is in Sell territory. Stochastic RSI, CCI, and Bull/Bear Power are all showing oversold conditions, suggesting short-term seller exhaustion, but none indicate a clear bullish reversal. Bull/Bear Power confirms ongoing intraday selling pressure, and the Awesome Oscillator also supports the prevailing downtrend. The price closed with a narrow gain and moderate volatility, despite opening with a gap down and closing near the session's high, highlighting a divergence between intraday recovery and the signal from underlying oscillators.
Downside scenario favored as volatility defines trading range
The forecast for RKT over the next several trading days is for movement within the GBX4,952 to GBX5,267 range. The probability of an upward move is 25%, with a much higher 75% likelihood of a downward move. The most likely scenario is a sideways pattern within this volatility band relative to current levels. A bullish break above resistance at GBX5,216 could allow a test toward the upper boundary, while a move below support risks accelerating toward the GBX4,952 area.
Earlier, analysts noted that Reckitt Benckiser exhibited a broadly bearish technical profile, with traders awaiting a decisive move to confirm direction. The latest data reinforces the ongoing downside bias, making a sustained move below immediate support a key downside risk to watch in the coming sessions.











-
 Afghanistan
-
 Albania
-
 Algeria
-
 Angola
-
 Argentina
-
 Armenia
-
 Australia
-
 Austria
-
 Azerbaijan
-
 Bahamas
-
 Bahrain
-
 Bangladesh
-
 Belarus
-
 Belgium
-
 Bolivia
-
 Botswana
-
 Brazil
-
 Brunei
-
 Bulgaria
-
 Cambodia
-
 Cameroon
-
 Canada
-
 Chile
-
 China
-
 Colombia
-
 Congo
-
 Costa Rica
-
 Cote d'Ivoire
-
 Croatia
-
 Cuba
-
 Cyprus
-
 Czechia
-
 DR Congo
-
 Denmark
-
 Dominican Republic
-
 Ecuador
-
 Egypt
-
 El Salvador
-
 Estonia
-
 Eswatini
-
 Ethiopia
-
 Finland
-
 France
-
 Georgia
-
 Germany
-
 Ghana
-
 Greece
-
 Haiti
-
 Hong Kong
-
 Hungary
-
 India
-
 Indonesia
-
 Iran, Islamic republic
-
 Iraq
-
 Ireland
-
 Israel
-
 Italy
-
 Jamaica
-
 Japan
-
 Jordan
-
 Kazakhstan
-
 Kenya
-
 Korea
-
 Kuwait
-
 Kyrgyzstan
-
 Laos
-
 Latvia
-
 Lebanon
-
 Lesotho
-
 Libya
-
 Lithuania
-
 Luxembourg
-
 Madagascar
-
 Malaysia
-
 Malta
-
 Mauritius
-
 Mexico
-
 Moldova
-
 Mongolia
-
 Montenegro
-
 Morocco
-
 Mozambique
-
 Myanmar
-
 Namibia
-
 Nepal
-
 Netherlands
-
 New Zealand
-
 Nigeria
-
 North Macedonia
-
 Norway
-
 Oman
-
 Pakistan
-
 Palestine
-
 Panama
-
 Papua New Guinea
-
 Paraguay
-
 Peru
-
 Philippines
-
 Poland
-
 Portugal
-
 Puerto Rico
-
 Qatar
-
 Reunion
-
 Romania
-
 Rwanda
-
 Saudi Arabia
-
 Serbia
-
 Singapore
-
 Slovakia
-
 Slovenia
-
 Somalia
-
 South Africa
-
 Spain
-
 Sri Lanka
-
 Sweden
-
 Switzerland
-
 Syria
-
 Taiwan
-
 Tajikistan
-
 Tanzania
-
 Thailand
-
 Trinidad and Tobago
-
 Tunisia
-
 Turkey
-
 UAE
-
 Uganda
-
 Ukraine
-
 United Kingdom
-
United States
-
 Uruguay
-
 Uzbekistan
-
 Venezuela
-
 Vietnam
-
 Yemen
-
 Zambia
-
 Zimbabwe
- Forex
- Crypto












