


HP Inc. (HPQ) stock is trading at $31.07, down 4.8% on the day. The price currently sits below its short-term averages but remains above its medium- and long-term levels.
 29.48
34.09
Highlights
- HP stock reached a new 52-week high, drawing increased market attention and momentum-based flows.
- Despite hitting a new high, the stock remains under broader selling pressure after a 4.8% intraday decline and high volatility.
- Technical signals indicate strong positive momentum, with a baseline trading range of $30.37 to $32.32 and a 61% probability of an upward move.
Momentum flows rise as 52-week high draws mixed sentiment
According to MarketBeat, HP reached a new 52-week high, which typically draws increased market attention and highlights underlying demand in the stock. Achieving a new high often attracts momentum-based investors, potentially accelerating buying flows as prior resistance levels are cleared. However, while this milestone underscores recent positive sentiment, price action has remained under broader selling pressure.
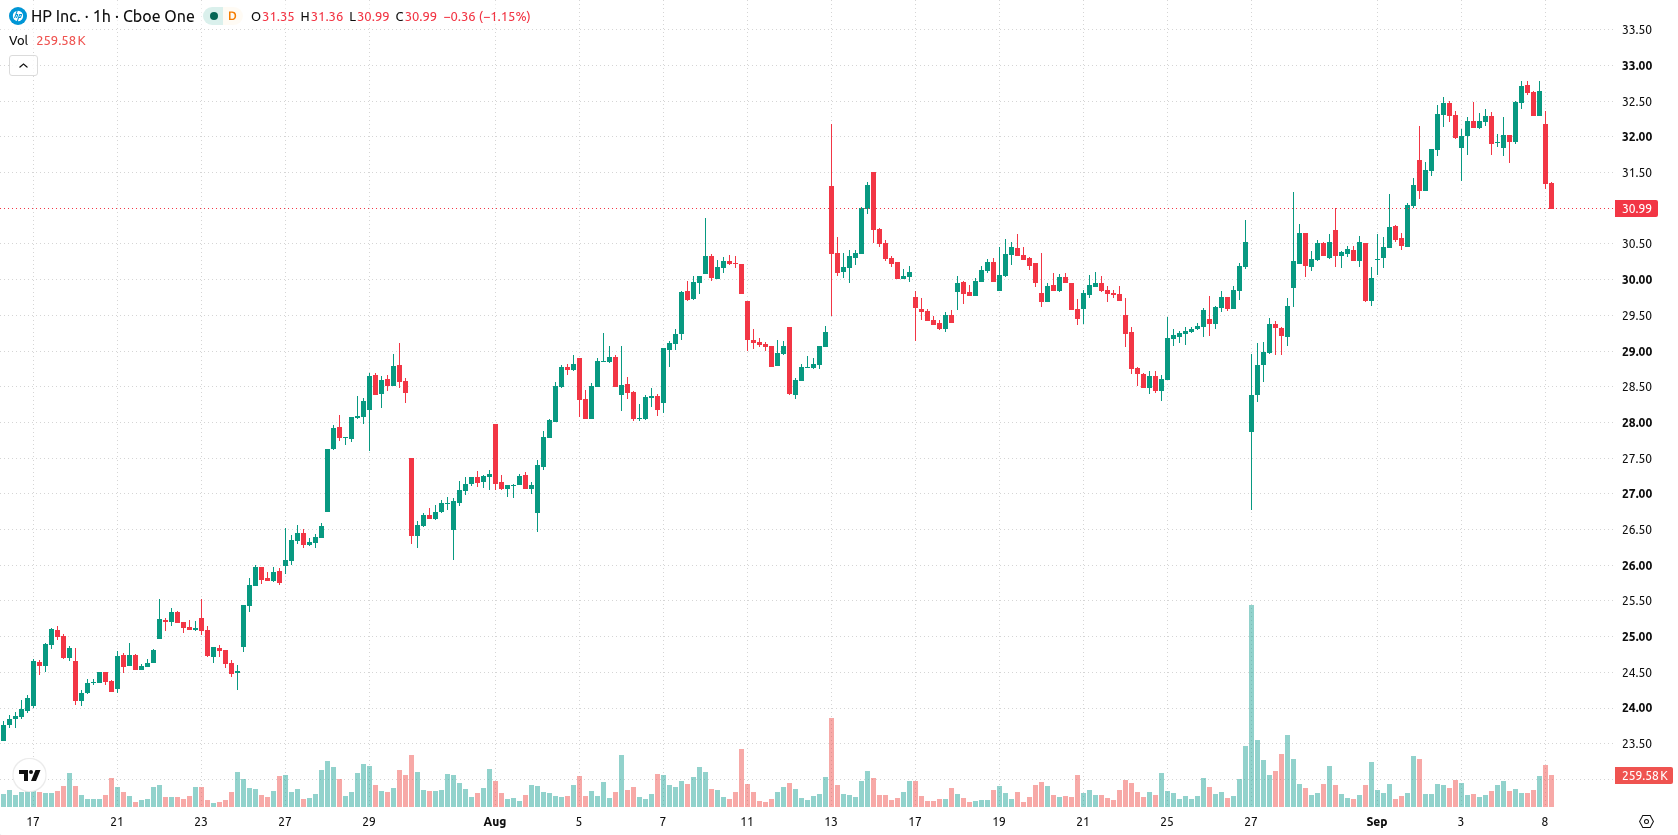
Overbought signals intensify as price tests key technical barriers
HPQ is trading below its MA-20 and above its MA-50 on the hourly timeframe, while the daily chart places it well above the MA-200. The Ichimoku Kijun at $31.59 presently acts as immediate resistance. Among momentum indicators, MACD signals Strong Buy and ADX indicates a Buy. The RSI stands at 63.75, and both Stoch RSI and CCI reflect overbought or strong buying conditions. Bull/Bear Power confirms the presence of buyers intraday, while the Awesome Oscillator also points to continuing upward price momentum.
Bullish breakout probability rises amid contained trading range
In the short term, HPQ is likely to consolidate within a trading range of $30.37 to $32.32. The probability of an upward move is currently estimated at 61%, with downside risk at 39%. Prices may continue to fluctuate within this volatility band, with a bullish breakout scenario triggered if resistance at $31.59 is broken. Conversely, a loss of support near $30.37 would be required to shift the outlook toward a bearish move.
Earlier, analysts noted that HP Inc. maintained a broadly bullish technical structure despite episodes of short-term volatility and selling pressure. The current environment reinforces this perspective, and traders should monitor the $31.59 resistance as a decisive trigger for the next directional move.










-
 Afghanistan
-
 Albania
-
 Algeria
-
 Angola
-
 Argentina
-
 Armenia
-
 Australia
-
 Austria
-
 Azerbaijan
-
 Bahamas
-
 Bahrain
-
 Bangladesh
-
 Belarus
-
 Belgium
-
 Bolivia
-
 Botswana
-
 Brazil
-
 Brunei
-
 Bulgaria
-
 Cambodia
-
 Cameroon
-
 Canada
-
 Chile
-
 China
-
 Colombia
-
 Congo
-
 Costa Rica
-
 Cote d'Ivoire
-
 Croatia
-
 Cuba
-
 Cyprus
-
 Czechia
-
 DR Congo
-
 Denmark
-
 Dominican Republic
-
 Ecuador
-
 Egypt
-
 El Salvador
-
 Estonia
-
 Eswatini
-
 Ethiopia
-
 Finland
-
 France
-
 Georgia
-
 Germany
-
 Ghana
-
 Greece
-
 Haiti
-
 Hong Kong
-
 Hungary
-
 India
-
 Indonesia
-
 Iran, Islamic republic
-
 Iraq
-
 Ireland
-
 Israel
-
 Italy
-
 Jamaica
-
 Japan
-
 Jordan
-
 Kazakhstan
-
 Kenya
-
 Korea
-
 Kuwait
-
 Kyrgyzstan
-
 Laos
-
 Latvia
-
 Lebanon
-
 Lesotho
-
 Libya
-
 Lithuania
-
 Luxembourg
-
 Madagascar
-
 Malaysia
-
 Malta
-
 Mauritius
-
 Mexico
-
 Moldova
-
 Mongolia
-
 Montenegro
-
 Morocco
-
 Mozambique
-
 Myanmar
-
 Namibia
-
 Nepal
-
 Netherlands
-
 New Zealand
-
 Nigeria
-
 North Macedonia
-
 Norway
-
 Oman
-
 Pakistan
-
 Palestine
-
 Panama
-
 Papua New Guinea
-
 Paraguay
-
 Peru
-
 Philippines
-
 Poland
-
 Portugal
-
 Puerto Rico
-
 Qatar
-
 Reunion
-
 Romania
-
 Rwanda
-
 Saudi Arabia
-
 Serbia
-
 Singapore
-
 Slovakia
-
 Slovenia
-
 Somalia
-
 South Africa
-
 Spain
-
 Sri Lanka
-
 Sweden
-
 Switzerland
-
 Syria
-
 Taiwan
-
 Tajikistan
-
 Tanzania
-
 Thailand
-
 Trinidad and Tobago
-
 Tunisia
-
 Turkey
-
 UAE
-
 Uganda
-
 Ukraine
-
 United Kingdom
-
United States
-
 Uruguay
-
 Uzbekistan
-
 Venezuela
-
 Vietnam
-
 Yemen
-
 Zambia
-
 Zimbabwe
- Forex
- Crypto












