

INTU tumbles around 5.5% as technical weakness and market skepticism weigh on shares

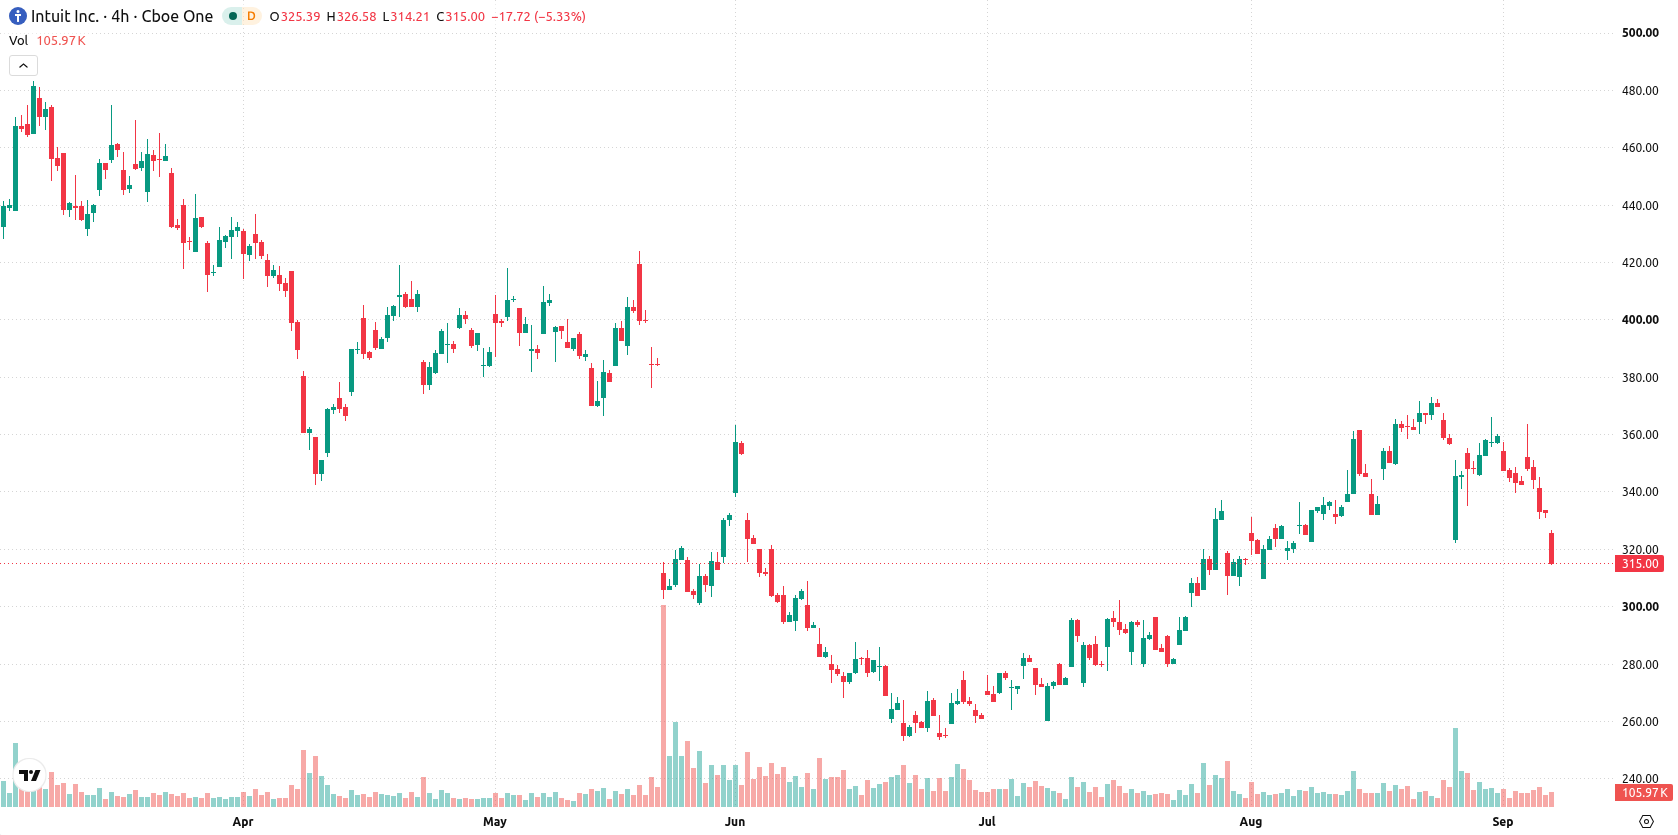
Intuit Inc. (INTU) fell 5.51% after weaker-than-expected TurboTax revenue growth and user numbers were disclosed in a recent class action lawsuit, with ongoing concerns over increased pricing and competitive pressures in the digital tax segment. The bearish momentum is reinforced as the stock remains below all key moving averages, and seller pressure dominates near-term trading.
 344.62
366.19
Highlights
- A class action lawsuit alleges Intuit overstated its competitive position after TurboTax revenue and user numbers missed expectations due to higher pricing and rising competition.
- Intuit approved a quarterly dividend increase to $1.38 per share and Wedmont Private Capital raised its stake during the second quarter of 2026.
- Shares of Intuit fell 5.51% to $314.31, trading below key moving averages, with a forecast range of $302.33 to $326.28 for the next five days and continued selling pressure indicated by oversold technical signals.
Investor repositioning intensifies as lawsuit exposes weak user growth
A class action lawsuit was filed alleging that Intuit overstated its competitive position and growth prospects, following disclosures that TurboTax revenue growth and user numbers fell short of expectations due to higher pricing and increased competition. The company declared a quarterly dividend increase to $1.38 per share, up from $1.20. Institutional investor Wedmont Private Capital was reported to have significantly increased its stake in the second quarter of 2026. The company continues to face scrutiny over its ability to defend its market position in digital tax and accounting solutions amid industry changes.
Mixed momentum clashes with deep oversold readings near resistance
Intuit is trading below its 20-day, 50-day, and 200-day moving averages at $349.45, $315.66, and $427.23 respectively, confirming persistent selling pressure in short-, medium-, and longer-term trends. The nearest levels are the near-term ceiling at $314.51 and the near-term floor at $302.33, with all significant moving averages and the Ichimoku Kijun at $340.63 far overhead, aligning with a bearish structure. Momentum indicators are mixed: the MACD signals strong buy, while the ADX is neutral at 15.6. The Relative Strength Index (RSI) reads 46.64 with a sell signal. Both the Commodity Channel Index (CCI) at -100.2 and the Stochastic RSI at 0 are oversold. Bull/Bear Power (BBP) at -4.79 indicates sellers dominate intraday momentum and the oversold forecast persists. There is a clear divergence between momentum and oscillator signals, with some buy momentum conflicting with deep oversold conditions and seller strength.
Previously it was reported that analysts remained cautious on Intuit due to ongoing litigation and persistent downside pressures despite the company’s financial strengths. The latest developments reinforce this view, with mixed technical signals and continuing legal uncertainties suggesting that traders should closely monitor the $302.33 support level for signs of further downside risk.










-
 Afghanistan
-
 Albania
-
 Algeria
-
 Angola
-
 Argentina
-
 Armenia
-
 Australia
-
 Austria
-
 Azerbaijan
-
 Bahamas
-
 Bahrain
-
 Bangladesh
-
 Belarus
-
 Belgium
-
 Bolivia
-
 Botswana
-
 Brazil
-
 Brunei
-
 Bulgaria
-
 Cambodia
-
 Cameroon
-
 Canada
-
 Chile
-
 China
-
 Colombia
-
 Congo
-
 Costa Rica
-
 Cote d'Ivoire
-
 Croatia
-
 Cuba
-
 Cyprus
-
 Czechia
-
 DR Congo
-
 Denmark
-
 Dominican Republic
-
 Ecuador
-
 Egypt
-
 El Salvador
-
 Estonia
-
 Eswatini
-
 Ethiopia
-
 Finland
-
 France
-
 Georgia
-
 Germany
-
 Ghana
-
 Greece
-
 Haiti
-
 Hong Kong
-
 Hungary
-
 India
-
 Indonesia
-
 Iran, Islamic republic
-
 Iraq
-
 Ireland
-
 Israel
-
 Italy
-
 Jamaica
-
 Japan
-
 Jordan
-
 Kazakhstan
-
 Kenya
-
 Korea
-
 Kuwait
-
 Kyrgyzstan
-
 Laos
-
 Latvia
-
 Lebanon
-
 Lesotho
-
 Libya
-
 Lithuania
-
 Luxembourg
-
 Madagascar
-
 Malaysia
-
 Malta
-
 Mauritius
-
 Mexico
-
 Moldova
-
 Mongolia
-
 Montenegro
-
 Morocco
-
 Mozambique
-
 Myanmar
-
 Namibia
-
 Nepal
-
 Netherlands
-
 New Zealand
-
 Nigeria
-
 North Macedonia
-
 Norway
-
 Oman
-
 Pakistan
-
 Palestine
-
 Panama
-
 Papua New Guinea
-
 Paraguay
-
 Peru
-
 Philippines
-
 Poland
-
 Portugal
-
 Puerto Rico
-
 Qatar
-
 Reunion
-
 Romania
-
 Rwanda
-
 Saudi Arabia
-
 Serbia
-
 Singapore
-
 Slovakia
-
 Slovenia
-
 Somalia
-
 South Africa
-
 Spain
-
 Sri Lanka
-
 Sweden
-
 Switzerland
-
 Syria
-
 Taiwan
-
 Tajikistan
-
 Tanzania
-
 Thailand
-
 Trinidad and Tobago
-
 Tunisia
-
 Turkey
-
 UAE
-
 Uganda
-
 Ukraine
-
 United Kingdom
-
United States
-
 Uruguay
-
 Uzbekistan
-
 Venezuela
-
 Vietnam
-
 Yemen
-
 Zambia
-
 Zimbabwe
- Forex
- Crypto












