

Why is Bit Digital stock rising today? Key resistance levels in focus

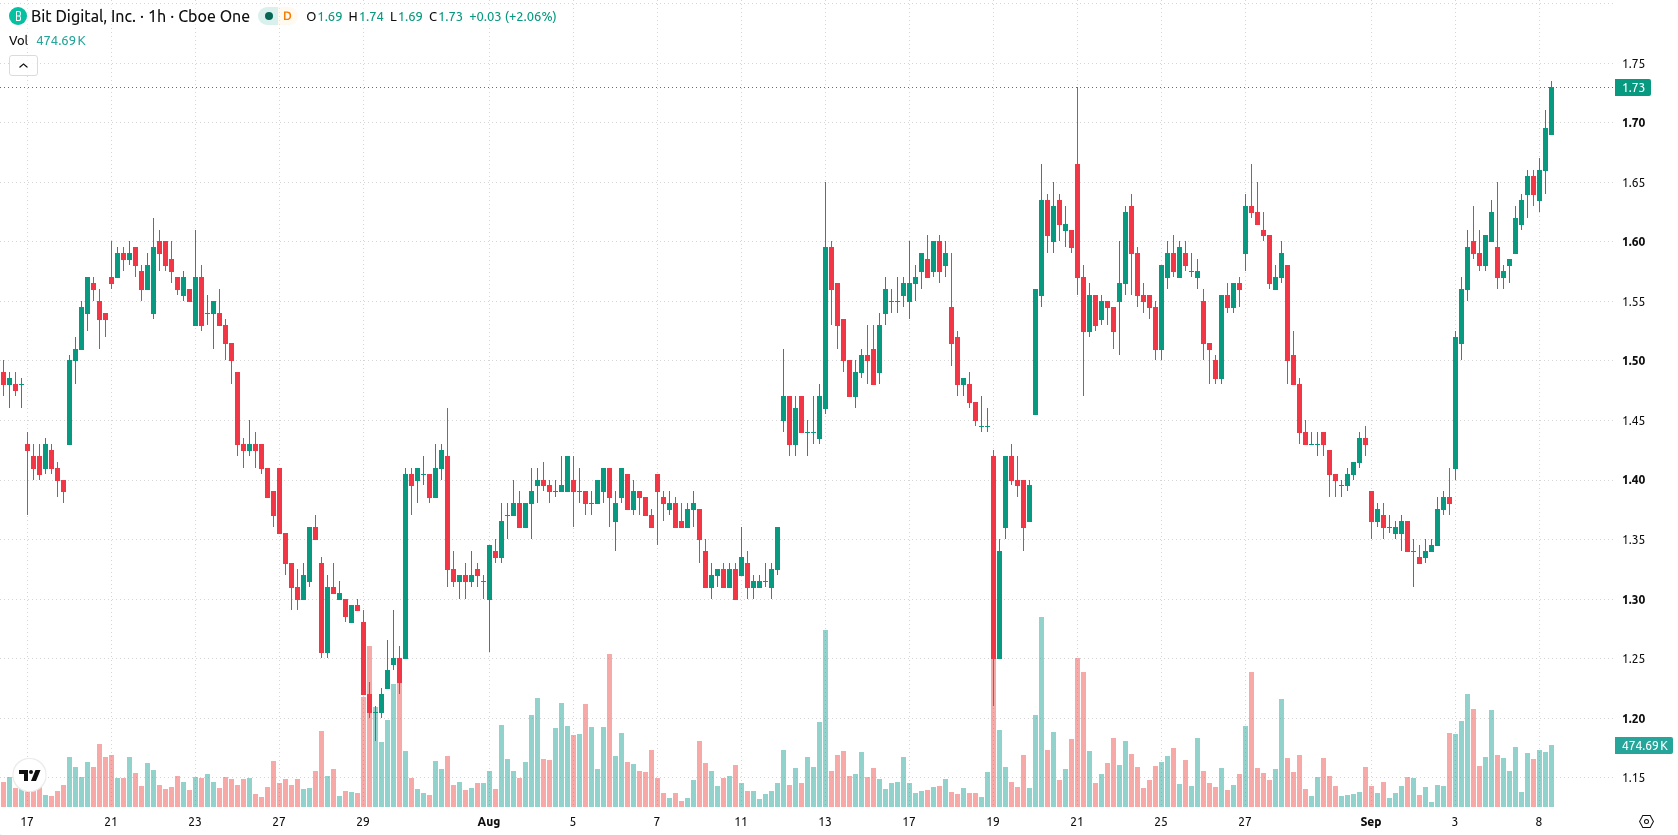
Bit Digital (BTBT) stock is trading at $1.72 after rising 5.21% on the day. The price currently sits above its key short- and medium-term moving averages, suggesting near-term momentum is positive.
 0.8300
0.9610
Highlights
- BTBT/USD shows short- and medium-term bullish momentum, remaining above short-term moving averages but below the long-term average.
- Momentum indicators support further gains with buyers in control, although Stoch RSI warns of overbought conditions.
- Price is projected to trade in the $1.57 to $1.87 range with high probability of upward movement and immediate support near $1.49.
Bullish momentum persists with overbought signal divergence
On the technical front, BTBT currently trades above its MA-20 at $1.53 and MA-50 at $1.49, while remaining below the longer-term MA-200 at $1.79. The Ichimoku Kijun at $1.49 serves as immediate support. Momentum indicators such as MACD and ADX show positive signals, while RSI is at 67.4 and CCI remains bullish. The Stoch RSI, however, signals overbought conditions (Strong Sell), and Bull/Bear Power indicates buyers dominate intraday action. The Awesome Oscillator also confirms the prevailing uptrend, though the Stoch RSI divergence suggests some caution may be warranted at these levels.
Consolidation likely as bullish bias dominates short-term outlook
Looking ahead, BTBT is projected to trade in a short-term range between $1.57 and $1.87 over the coming days. With a very high probability of further upward movement and low probability of decline, the baseline scenario is for consolidation within this volatility band. A bullish breakout above the range could ignite additional gains, while a sustained move below immediate support near $1.57 would turn the scenario bearish.
In a recent review, Bit Digital was noted for strong short-term momentum despite longer-term technical resistance, with analysts emphasizing the importance of consolidation or a potential breakout. The latest developments not only reinforce this view but also suggest that traders should closely watch for volatility-driven moves outside the current $1.57–$1.87 range, as a breakout could signal a shift in the prevailing trend.






Latest Bit Digital News



-
 Afghanistan
-
 Albania
-
 Algeria
-
 Angola
-
 Argentina
-
 Armenia
-
 Australia
-
 Austria
-
 Azerbaijan
-
 Bahamas
-
 Bahrain
-
 Bangladesh
-
 Belarus
-
 Belgium
-
 Bolivia
-
 Botswana
-
 Brazil
-
 Brunei
-
 Bulgaria
-
 Cambodia
-
 Cameroon
-
 Canada
-
 Chile
-
 China
-
 Colombia
-
 Congo
-
 Costa Rica
-
 Cote d'Ivoire
-
 Croatia
-
 Cuba
-
 Cyprus
-
 Czechia
-
 DR Congo
-
 Denmark
-
 Dominican Republic
-
 Ecuador
-
 Egypt
-
 El Salvador
-
 Estonia
-
 Eswatini
-
 Ethiopia
-
 Finland
-
 France
-
 Georgia
-
 Germany
-
 Ghana
-
 Greece
-
 Haiti
-
 Hong Kong
-
 Hungary
-
 India
-
 Indonesia
-
 Iran, Islamic republic
-
 Iraq
-
 Ireland
-
 Israel
-
 Italy
-
 Jamaica
-
 Japan
-
 Jordan
-
 Kazakhstan
-
 Kenya
-
 Korea
-
 Kuwait
-
 Kyrgyzstan
-
 Laos
-
 Latvia
-
 Lebanon
-
 Lesotho
-
 Libya
-
 Lithuania
-
 Luxembourg
-
 Madagascar
-
 Malaysia
-
 Malta
-
 Mauritius
-
 Mexico
-
 Moldova
-
 Mongolia
-
 Montenegro
-
 Morocco
-
 Mozambique
-
 Myanmar
-
 Namibia
-
 Nepal
-
 Netherlands
-
 New Zealand
-
 Nigeria
-
 North Macedonia
-
 Norway
-
 Oman
-
 Pakistan
-
 Palestine
-
 Panama
-
 Papua New Guinea
-
 Paraguay
-
 Peru
-
 Philippines
-
 Poland
-
 Portugal
-
 Puerto Rico
-
 Qatar
-
 Reunion
-
 Romania
-
 Rwanda
-
 Saudi Arabia
-
 Serbia
-
 Singapore
-
 Slovakia
-
 Slovenia
-
 Somalia
-
 South Africa
-
 Spain
-
 Sri Lanka
-
 Sweden
-
 Switzerland
-
 Syria
-
 Taiwan
-
 Tajikistan
-
 Tanzania
-
 Thailand
-
 Trinidad and Tobago
-
 Tunisia
-
 Turkey
-
 UAE
-
 Uganda
-
 Ukraine
-
 United Kingdom
-
United States
-
 Uruguay
-
 Uzbekistan
-
 Venezuela
-
 Vietnam
-
 Yemen
-
 Zambia
-
 Zimbabwe
- Forex
- Crypto












