

Riot Platforms stock rises around 3.5% as technical momentum and buying pressure fuel rally

Riot Platforms, Inc. (RIOT) advanced 3.58% as strong technical momentum and sustained buying pressure pushed the stock toward session highs. The bullish tone is supported by the price trading above all major moving averages, though overbought signals and immediate resistance near $22.63 may limit further upside.
 16.21
14.43
Highlights
- Riot Platforms stock is trading above its key moving averages, establishing a bullish outlook across timeframes.
- Overbought oscillator readings and mixed momentum indicators suggest buyers are dominant but the trend strength remains neutral.
- Near-term resistance is at $22.63 and support is at $21.77, with an expected five-day range of $20.39 to $24.71.
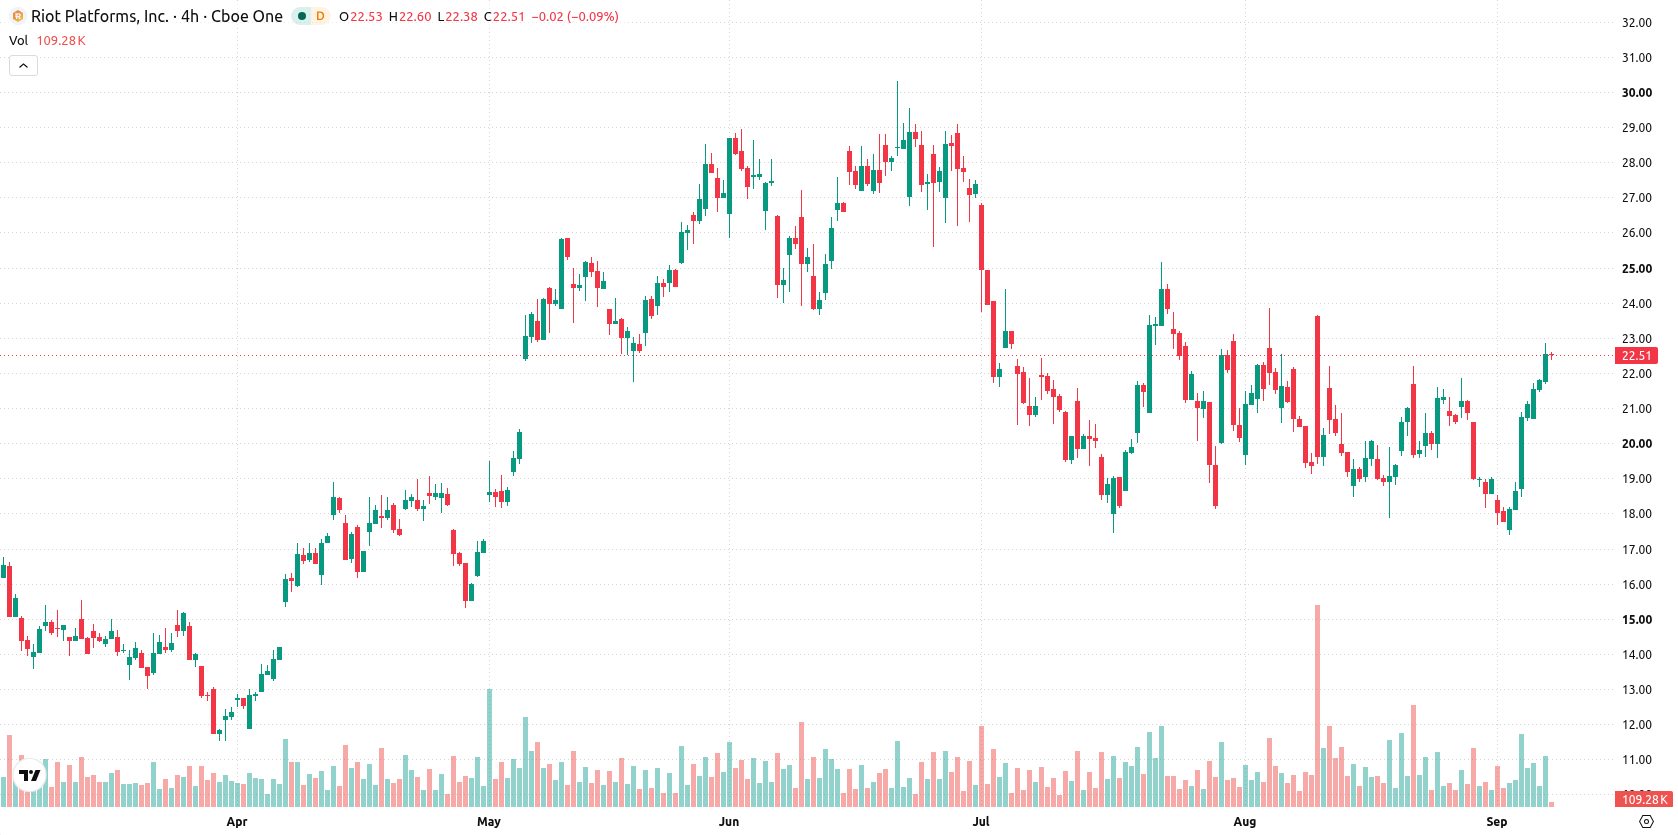
Bullish trend persists as mixed momentum tempers breakout
Riot Platforms is currently trading above its 20-day ($19.86), 50-day ($21.07), and 200-day ($18.66) moving averages, which signals a bullish structure across short-, medium-, and long-term outlooks. Immediate price action is capped by near-term resistance at $22.63, with support at $21.77. The longer-term trend remains positive based on the bullish MA-50 versus MA-200 alignment, with the Ichimoku Kijun ($20.64) adding a supportive undertone. Momentum readings are mixed: the MACD signals strong selling pressure while the Average Directional Index (ADX) indicates a neutral trend. The Relative Strength Index (RSI) stands at 55.46 with a buy forecast, whereas the Stochastic RSI, Commodity Channel Index (CCI), and Bull/Bear Power (BBP) all point to overbought conditions, confirming buyers currently dominate intraday action. Intraday volatility is 4.53%.
Earlier, analysts noted that Riot Platforms was exhibiting bullish technical momentum while signaling the possibility of continued volatility within its established range. The latest analysis confirms this positive structure and highlights that traders should monitor for a confirmed breakout above near-term resistance or a potential retracement to the lower boundary of the current volatility band.











-
 Afghanistan
-
 Albania
-
 Algeria
-
 Angola
-
 Argentina
-
 Armenia
-
 Australia
-
 Austria
-
 Azerbaijan
-
 Bahamas
-
 Bahrain
-
 Bangladesh
-
 Belarus
-
 Belgium
-
 Bolivia
-
 Botswana
-
 Brazil
-
 Brunei
-
 Bulgaria
-
 Cambodia
-
 Cameroon
-
 Canada
-
 Chile
-
 China
-
 Colombia
-
 Congo
-
 Costa Rica
-
 Cote d'Ivoire
-
 Croatia
-
 Cuba
-
 Cyprus
-
 Czechia
-
 DR Congo
-
 Denmark
-
 Dominican Republic
-
 Ecuador
-
 Egypt
-
 El Salvador
-
 Estonia
-
 Eswatini
-
 Ethiopia
-
 Finland
-
 France
-
 Georgia
-
 Germany
-
 Ghana
-
 Greece
-
 Haiti
-
 Hong Kong
-
 Hungary
-
 India
-
 Indonesia
-
 Iran, Islamic republic
-
 Iraq
-
 Ireland
-
 Israel
-
 Italy
-
 Jamaica
-
 Japan
-
 Jordan
-
 Kazakhstan
-
 Kenya
-
 Korea
-
 Kuwait
-
 Kyrgyzstan
-
 Laos
-
 Latvia
-
 Lebanon
-
 Lesotho
-
 Libya
-
 Lithuania
-
 Luxembourg
-
 Madagascar
-
 Malaysia
-
 Malta
-
 Mauritius
-
 Mexico
-
 Moldova
-
 Mongolia
-
 Montenegro
-
 Morocco
-
 Mozambique
-
 Myanmar
-
 Namibia
-
 Nepal
-
 Netherlands
-
 New Zealand
-
 Nigeria
-
 North Macedonia
-
 Norway
-
 Oman
-
 Pakistan
-
 Palestine
-
 Panama
-
 Papua New Guinea
-
 Paraguay
-
 Peru
-
 Philippines
-
 Poland
-
 Portugal
-
 Puerto Rico
-
 Qatar
-
 Reunion
-
 Romania
-
 Rwanda
-
 Saudi Arabia
-
 Serbia
-
 Singapore
-
 Slovakia
-
 Slovenia
-
 Somalia
-
 South Africa
-
 Spain
-
 Sri Lanka
-
 Sweden
-
 Switzerland
-
 Syria
-
 Taiwan
-
 Tajikistan
-
 Tanzania
-
 Thailand
-
 Trinidad and Tobago
-
 Tunisia
-
 Turkey
-
 UAE
-
 Uganda
-
 Ukraine
-
 United Kingdom
-
United States
-
 Uruguay
-
 Uzbekistan
-
 Venezuela
-
 Vietnam
-
 Yemen
-
 Zambia
-
 Zimbabwe
- Forex
- Crypto












