

KLA stock trades near $178.87 support as weak momentum pressures price

KLA (KLAC) stock is trading at $182.21 after a daily decline of 3.46%. The price has slipped below its short-term moving average but remains above intermediate and long-term averages.
 158.41
171.22
Highlights
- KLA generated $817 million in free cash flow for fiscal Q4 and $3.77 billion for the year, returning $3.35 billion to shareholders.
- Institutional investors including Allworth Financial LP and Pinnacle Wealth Management Advisory Group LLC significantly increased their holdings in KLA during Q2.
- Shares of KLA fell 3.46% to $182.21 with near-term technical signals mixed and a projected range of $171.81 to $192.61 over the next 2 to 3 days.
Buybacks, accumulation, and growth plans amid persistent selling
KLA Corporation reported fiscal Q4 free cash flow of approximately $817 million and $3.77 billion for the full year, according to Alphaos. This strong operational performance underpinned the company's return of around $3.35 billion to shareholders through dividends and repurchases, also cited by Alphaos. Meanwhile, substantial institutional accumulation was noted with Allworth Financial LP and Pinnacle Wealth Management Advisory Group LLC sharply increasing their holdings in KLA over the second quarter, as reported by Themarketsdaily. Additionally, management outlined a growth-focused strategy at Citi’s 2026 Global TMT Conference, highlighting opportunities in semiconductor process control and advanced packaging, according to Investing.com, though price action has remained under broader selling pressure.
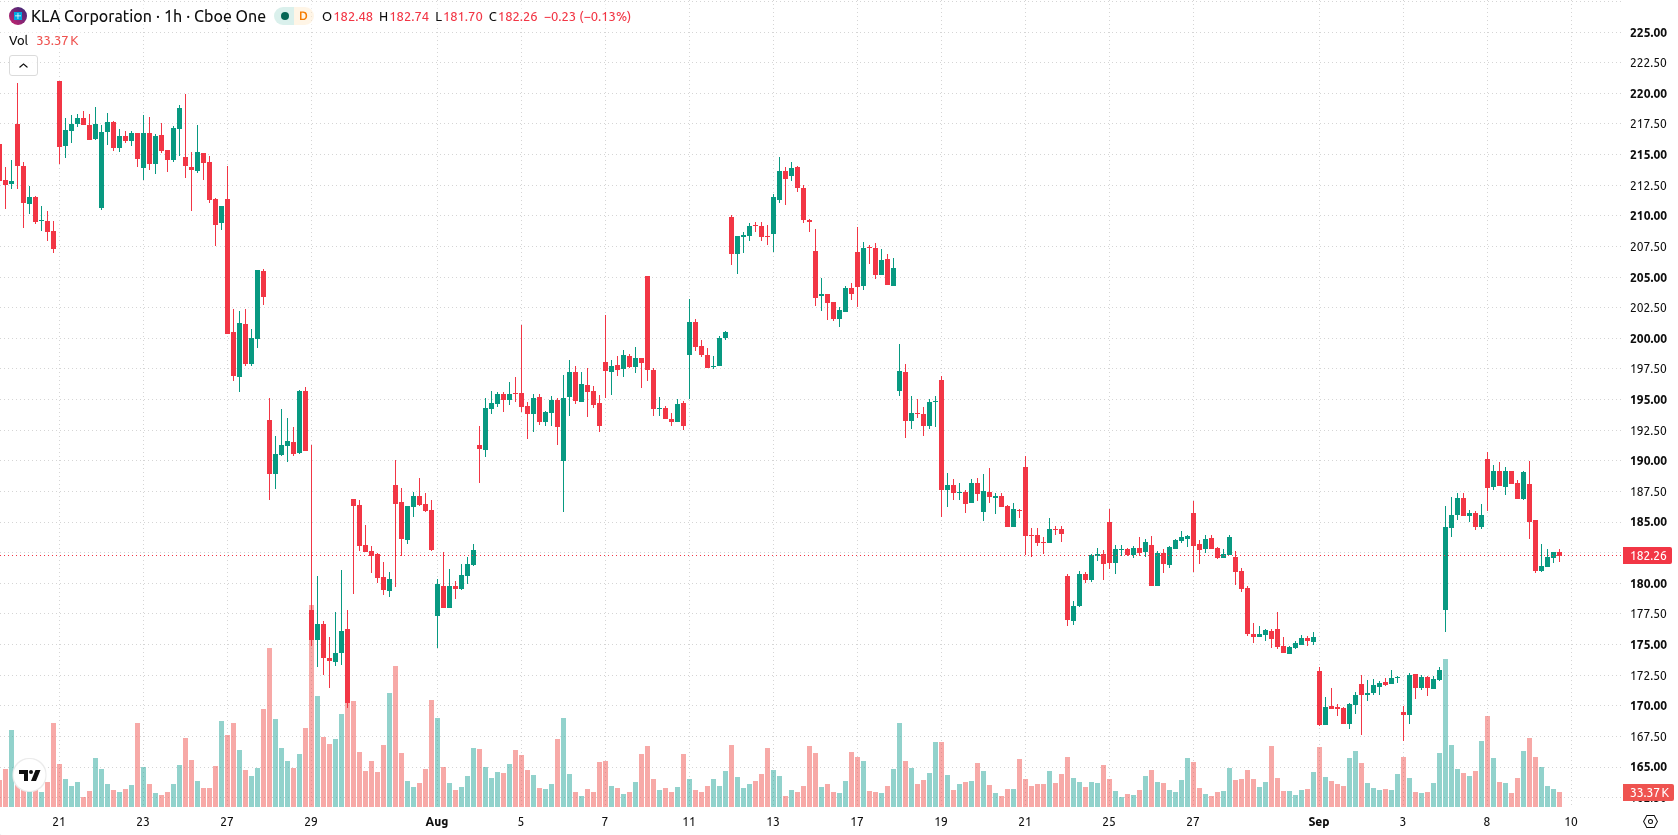
Support levels and mixed momentum as volatility drives divergence
The MA-20 is currently below the price, while both the MA-50 and MA-200 remain as medium- and long-term support levels, establishing $178.87 as the key Ichimoku Kijun support. Among oscillators, MACD shows a strong buy and ADX also offers a buy signal; however, RSI is at 48.98 with a Sell signal and Stoch RSI has moved into oversold territory. CCI and Awesome Oscillator are both neutral, while Bull/Bear Power indicates sellers dominating intraday activity. This set of mixed momentum indicators, combined with high volatility during the session, points to divergence across trend and oscillator signals.
Sideways trading forecast as downside risk rises near support
Over the next 2–3 trading days, KLAC is expected to fluctuate between $171.81 and $192.61, comprising a typical short-term volatility band relative to current levels. The probability of a downside move is marginally higher at 52%, while an upward move is estimated at 48%. If the price breaches resistance, an upward scenario could develop, whereas a decline below support at the Kijun level risks a further extension to the downside. The baseline expectation is for sideways trading within this corridor.
Earlier, analysts noted that despite strong fundamental performance KLA Corporation's shares were constrained by persistent technical pressure. The current analysis adds a new dimension by highlighting growing institutional accumulation and robust cash flow, with volatility elevated—investors should monitor the $178.87 Kijun support and the $192.61 resistance as pivotal levels for the next directional move.






Latest KLA Corporation News



-
 Afghanistan
-
 Albania
-
 Algeria
-
 Angola
-
 Argentina
-
 Armenia
-
 Australia
-
 Austria
-
 Azerbaijan
-
 Bahamas
-
 Bahrain
-
 Bangladesh
-
 Belarus
-
 Belgium
-
 Bolivia
-
 Botswana
-
 Brazil
-
 Brunei
-
 Bulgaria
-
 Cambodia
-
 Cameroon
-
 Canada
-
 Chile
-
 China
-
 Colombia
-
 Congo
-
 Costa Rica
-
 Cote d'Ivoire
-
 Croatia
-
 Cuba
-
 Cyprus
-
 Czechia
-
 DR Congo
-
 Denmark
-
 Dominican Republic
-
 Ecuador
-
 Egypt
-
 El Salvador
-
 Estonia
-
 Eswatini
-
 Ethiopia
-
 Finland
-
 France
-
 Georgia
-
 Germany
-
 Ghana
-
 Greece
-
 Haiti
-
 Hong Kong
-
 Hungary
-
 India
-
 Indonesia
-
 Iran, Islamic republic
-
 Iraq
-
 Ireland
-
 Israel
-
 Italy
-
 Jamaica
-
 Japan
-
 Jordan
-
 Kazakhstan
-
 Kenya
-
 Korea
-
 Kuwait
-
 Kyrgyzstan
-
 Laos
-
 Latvia
-
 Lebanon
-
 Lesotho
-
 Libya
-
 Lithuania
-
 Luxembourg
-
 Madagascar
-
 Malaysia
-
 Malta
-
 Mauritius
-
 Mexico
-
 Moldova
-
 Mongolia
-
 Montenegro
-
 Morocco
-
 Mozambique
-
 Myanmar
-
 Namibia
-
 Nepal
-
 Netherlands
-
 New Zealand
-
 Nigeria
-
 North Macedonia
-
 Norway
-
 Oman
-
 Pakistan
-
 Palestine
-
 Panama
-
 Papua New Guinea
-
 Paraguay
-
 Peru
-
 Philippines
-
 Poland
-
 Portugal
-
 Puerto Rico
-
 Qatar
-
 Reunion
-
 Romania
-
 Rwanda
-
 Saudi Arabia
-
 Serbia
-
 Singapore
-
 Slovakia
-
 Slovenia
-
 Somalia
-
 South Africa
-
 Spain
-
 Sri Lanka
-
 Sweden
-
 Switzerland
-
 Syria
-
 Taiwan
-
 Tajikistan
-
 Tanzania
-
 Thailand
-
 Trinidad and Tobago
-
 Tunisia
-
 Turkey
-
 UAE
-
 Uganda
-
 Ukraine
-
 United Kingdom
-
United States
-
 Uruguay
-
 Uzbekistan
-
 Venezuela
-
 Vietnam
-
 Yemen
-
 Zambia
-
 Zimbabwe
- Forex
- Crypto












