

AbbVie stock faces resistance at $254.08 with bounce potential in focus: weekly analysis

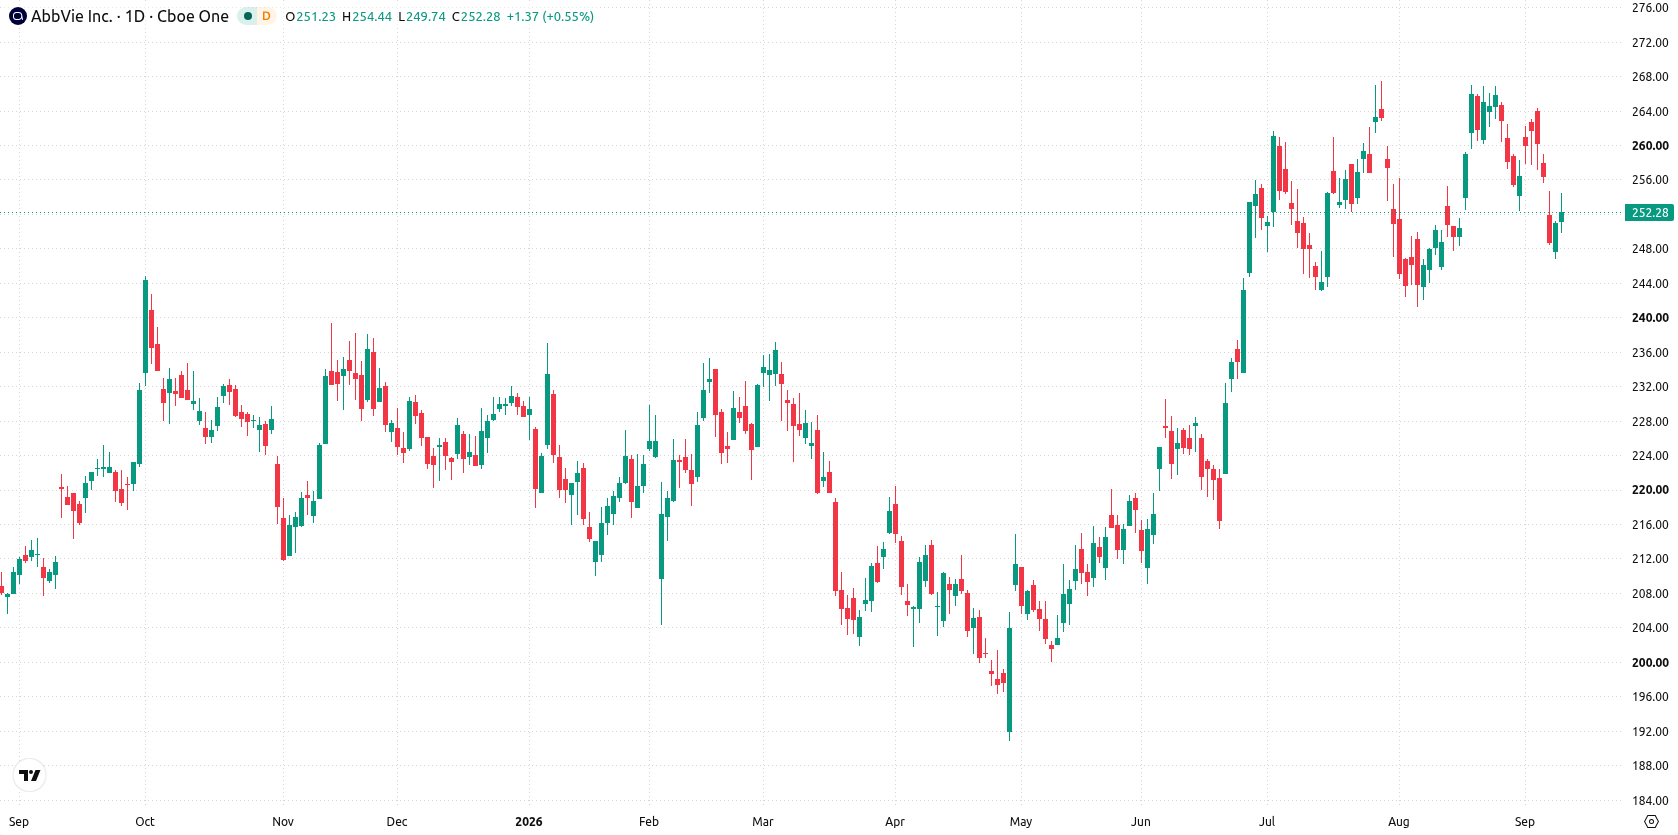
Shares of AbbVie Inc. (ABBV) are trading near $252 as a more than 1.5% decline stretched the stock into oversold territory last week. Conflicting signals from momentum indicators and a tight trading range suggest indecision, with traders attentive to whether support levels can spark a near-term reversal heading into the new week.
 291.73
302.68
Highlights
- Shares of AbbVie have declined 1.67% over the past seven days to $252.28, reflecting a short-term pullback.
- The stock trades below the 20-day and 50-day moving averages, but remains well above its 200-day average, showing a bullish long-term setup.
- Technical signals are mixed with volatility at 4.99% and a base case for consolidation between $246.77 and $259.15 in the coming week.
Pipeline expansion and trial success drive upbeat sentiment for the week
AbbVie completed its $10.9 billion acquisition of Apogee Therapeutics on September 3, 2026, adding key dermatology and respiratory assets to its immunology pipeline, according to PR Newswire. The company also announced positive topline results from the Phase 3 CERVINO trial, where etentamig posted a 74% objective response rate and reduced disease progression risk by 60% in relapsed or refractory multiple myeloma. At the Wells Fargo Healthcare Conference, ABBV highlighted near-term growth reliance on oncology, neuroscience, and further immunology innovation, boosting investor focus on its expanding pipeline for the week ahead.
Stabilization signals emerge as mixed momentum readings counter flat trend
The daily chart shows a flat trend, with recent action shaped by a contained move within a narrow range and 4.99% volatility. Momentum indicators are split: the RSI sits in neutral territory at 44.25, while both CCI and Stochastic RSI register oversold, highlighting some underlying support for a bounce. The nearest support is found at $246.77, with resistance marked by the Ichimoku Kijun at $254.08. This mixed setup points to stabilization, but with the potential for a near-term reversal if momentum turns upward.
Consolidation bias prevails as breakout risk hinges on key resistance
Over the coming trading week, AbbVie is expected to move within a $246.77 to $259.15 range, supported by a 60% probability of an increase versus a 40% chance of a decrease. The base case calls for consolidation between these boundaries. A decisive move above resistance at $254.08 would set up a test toward the upper end of the expected range, while a fall below $246.77 would expose the stock to further downside.
Previously it was reported that AbbVie was experiencing near-term technical pressure despite solid earnings and ongoing acquisition activity. The current analysis adds a new dimension by incorporating recent clinical trial successes and expanded pipeline updates, highlighting $254.08 as a key resistance level that may trigger a shift in trading direction if breached.











-
 Afghanistan
-
 Albania
-
 Algeria
-
 Angola
-
 Argentina
-
 Armenia
-
 Australia
-
 Austria
-
 Azerbaijan
-
 Bahamas
-
 Bahrain
-
 Bangladesh
-
 Belarus
-
 Belgium
-
 Bolivia
-
 Botswana
-
 Brazil
-
 Brunei
-
 Bulgaria
-
 Cambodia
-
 Cameroon
-
 Canada
-
 Chile
-
 China
-
 Colombia
-
 Congo
-
 Costa Rica
-
 Cote d'Ivoire
-
 Croatia
-
 Cuba
-
 Cyprus
-
 Czechia
-
 DR Congo
-
 Denmark
-
 Dominican Republic
-
 Ecuador
-
 Egypt
-
 El Salvador
-
 Estonia
-
 Eswatini
-
 Ethiopia
-
 Finland
-
 France
-
 Georgia
-
 Germany
-
 Ghana
-
 Greece
-
 Haiti
-
 Hong Kong
-
 Hungary
-
 India
-
 Indonesia
-
 Iran, Islamic republic
-
 Iraq
-
 Ireland
-
 Israel
-
 Italy
-
 Jamaica
-
 Japan
-
 Jordan
-
 Kazakhstan
-
 Kenya
-
 Korea
-
 Kuwait
-
 Kyrgyzstan
-
 Laos
-
 Latvia
-
 Lebanon
-
 Lesotho
-
 Libya
-
 Lithuania
-
 Luxembourg
-
 Madagascar
-
 Malaysia
-
 Malta
-
 Mauritius
-
 Mexico
-
 Moldova
-
 Mongolia
-
 Montenegro
-
 Morocco
-
 Mozambique
-
 Myanmar
-
 Namibia
-
 Nepal
-
 Netherlands
-
 New Zealand
-
 Nigeria
-
 North Macedonia
-
 Norway
-
 Oman
-
 Pakistan
-
 Palestine
-
 Panama
-
 Papua New Guinea
-
 Paraguay
-
 Peru
-
 Philippines
-
 Poland
-
 Portugal
-
 Puerto Rico
-
 Qatar
-
 Reunion
-
 Romania
-
 Rwanda
-
 Saudi Arabia
-
 Serbia
-
 Singapore
-
 Slovakia
-
 Slovenia
-
 Somalia
-
 South Africa
-
 Spain
-
 Sri Lanka
-
 Sweden
-
 Switzerland
-
 Syria
-
 Taiwan
-
 Tajikistan
-
 Tanzania
-
 Thailand
-
 Trinidad and Tobago
-
 Tunisia
-
 Turkey
-
 UAE
-
 Uganda
-
 Ukraine
-
 United Kingdom
-
United States
-
 Uruguay
-
 Uzbekistan
-
 Venezuela
-
 Vietnam
-
 Yemen
-
 Zambia
-
 Zimbabwe
- Forex
- Crypto












