

Riot Platforms stock drops almost 4% after momentum signals diverge amid sideways consolidation

A technical overhang and mixed momentum signals prompted Riot Platforms, Inc. (RIOT) to fall 3.87% on the day, as the asset experienced a downside gap and sideways consolidation following an initial drop. The retreat looks limited by the fact that RIOT continues to trade above all major moving averages, confirming an overall bullish structure across time frames.
 12.92
14.44
Highlights
- Riot Platforms stock trades above short, medium, and long-term moving averages, showing a broadly bullish technical structure.
- Momentum indicators are mixed, with signals split between overbought exhaustion and the absence of strong trend acceleration.
- Expected five-day price range is $20.13 to $22.26, with a 62% chance of an increase and consolidation likely unless key levels break.
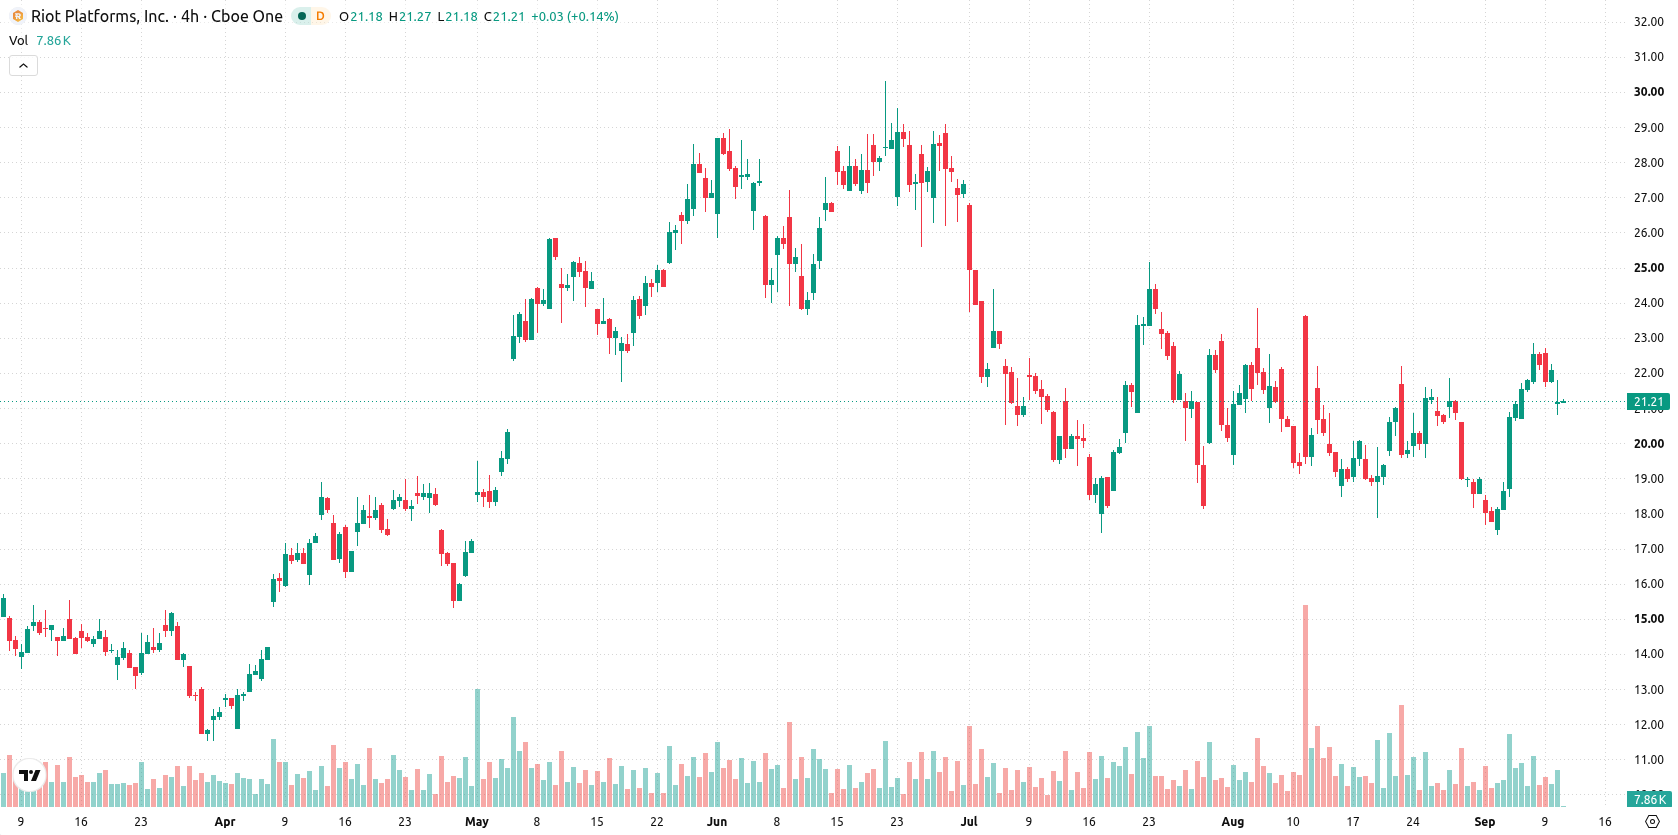
Bullish structure persists amid overbought signals and neutral momentum
Riot Platforms is trading above all key moving averages, with the price at $21.22 above the 20-day ($20.10), 50-day ($20.83), and 200-day ($18.74) marks, supporting a bullish structure in short, medium, and long-term views. The immediate ceiling is formed by today's high at $21.82, with first support at the 50-day moving average of $20.83. The bullish alignment between the 50-day and 200-day moving averages further underlines longer-term resilience. Momentum readings are mixed: the MACD and ADX indicate neutral trend strength, while the RSI highlights a buy signal; however, Stochastic RSI, CCI, and Bull/Bear Power all appear overbought, and BBP shows buyers are in control intraday. The Awesome Oscillator echoes the recent bullish pattern. After today's opening downside gap and nearly 4% pullback, the tone is one of sideways consolidation as technical indicators diverge between persistent overbought conditions and an absence of strong trend direction.
Earlier, analysts noted that Riot Platforms was exhibiting a bullish technical structure while signaling the potential for continued volatility and risk of range-bound consolidation. The latest market action reinforces this theme, as persistent mixed momentum and overbought conditions sustain a sideways scenario, making a decisive breakout above $21.82 or breakdown below $20.83 the key triggers to monitor in the coming sessions.









-
 Afghanistan
-
 Albania
-
 Algeria
-
 Angola
-
 Argentina
-
 Armenia
-
 Australia
-
 Austria
-
 Azerbaijan
-
 Bahamas
-
 Bahrain
-
 Bangladesh
-
 Belarus
-
 Belgium
-
 Bolivia
-
 Botswana
-
 Brazil
-
 Brunei
-
 Bulgaria
-
 Cambodia
-
 Cameroon
-
 Canada
-
 Chile
-
 China
-
 Colombia
-
 Congo
-
 Costa Rica
-
 Cote d'Ivoire
-
 Croatia
-
 Cuba
-
 Cyprus
-
 Czechia
-
 DR Congo
-
 Denmark
-
 Dominican Republic
-
 Ecuador
-
 Egypt
-
 El Salvador
-
 Estonia
-
 Eswatini
-
 Ethiopia
-
 Finland
-
 France
-
 Georgia
-
 Germany
-
 Ghana
-
 Greece
-
 Haiti
-
 Hong Kong
-
 Hungary
-
 India
-
 Indonesia
-
 Iran, Islamic republic
-
 Iraq
-
 Ireland
-
 Israel
-
 Italy
-
 Jamaica
-
 Japan
-
 Jordan
-
 Kazakhstan
-
 Kenya
-
 Korea
-
 Kuwait
-
 Kyrgyzstan
-
 Laos
-
 Latvia
-
 Lebanon
-
 Lesotho
-
 Libya
-
 Lithuania
-
 Luxembourg
-
 Madagascar
-
 Malaysia
-
 Malta
-
 Mauritius
-
 Mexico
-
 Moldova
-
 Mongolia
-
 Montenegro
-
 Morocco
-
 Mozambique
-
 Myanmar
-
 Namibia
-
 Nepal
-
 Netherlands
-
 New Zealand
-
 Nigeria
-
 North Macedonia
-
 Norway
-
 Oman
-
 Pakistan
-
 Palestine
-
 Panama
-
 Papua New Guinea
-
 Paraguay
-
 Peru
-
 Philippines
-
 Poland
-
 Portugal
-
 Puerto Rico
-
 Qatar
-
 Reunion
-
 Romania
-
 Rwanda
-
 Saudi Arabia
-
 Serbia
-
 Singapore
-
 Slovakia
-
 Slovenia
-
 Somalia
-
 South Africa
-
 Spain
-
 Sri Lanka
-
 Sweden
-
 Switzerland
-
 Syria
-
 Taiwan
-
 Tajikistan
-
 Tanzania
-
 Thailand
-
 Trinidad and Tobago
-
 Tunisia
-
 Turkey
-
 UAE
-
 Uganda
-
 Ukraine
-
 United Kingdom
-
United States
-
 Uruguay
-
 Uzbekistan
-
 Venezuela
-
 Vietnam
-
 Yemen
-
 Zambia
-
 Zimbabwe
- Forex
- Crypto












